ไทม์เฟรม (Timeframe) เลือกอย่างไรให้เหมาะกับตัวเองChoosing Timeframes
เข้าใจว่าไทม์เฟรมแต่ละระดับให้ภาพตลาดต่างกันอย่างไร และเลือกไทม์เฟรมที่เข้ากับเวลา นิสัย และขนาดพอร์ตของคุณUnderstand how each timeframe shows the market differently, and choose the ones that fit your time, temperament and account size.
ในบทความนี้ · 8
In this article · 8
กราฟเดียวกัน ถ้ามองคนละไทม์เฟรม (Timeframe) อาจเห็นคนละเรื่อง กราฟ M5 อาจกำลังพุ่งขึ้น ขณะที่กราฟ D1 อยู่ในขาลงชัดเจน การเลือกไทม์เฟรมไม่ใช่แค่เรื่องความชอบ แต่กำหนดว่าคุณต้องนั่งหน้าจอนานแค่ไหน SL กว้างเท่าไร และต้นทุนกินกำไรมากแค่ไหน
ไทม์เฟรมคืออะไร
ไทม์เฟรมคือระยะเวลาที่แท่งเทียนหนึ่งแท่งครอบคลุม ใน MT4/MT5 มีชุดหลัก ๆ:
| ตัวย่อ | หนึ่งแท่ง = | จำนวนแท่งต่อวัน (24 ชม.) |
|---|---|---|
| M1 / M5 / M15 | 1 / 5 / 15 นาที | 1,440 / 288 / 96 |
| H1 | 1 ชั่วโมง | 24 |
| H4 | 4 ชั่วโมง | 6 |
| D1 | 1 วัน | 1 |
| W1 / MN | 1 สัปดาห์ / 1 เดือน | — |
ข้อมูลเดียวกันถูก "บีบ" ให้อยู่ในแท่งน้อยลงเมื่อไทม์เฟรมใหญ่ขึ้น แท่ง H1 หนึ่งแท่งคือแท่ง M5 สิบสองแท่งรวมกัน ราคาเปิดคือราคาเปิดของแท่ง M5 แรก ราคาปิดคือราคาปิดของแท่ง M5 สุดท้าย
ไทม์เฟรมเล็ก กับไทม์เฟรมใหญ่
ไทม์เฟรมเล็ก (M1–M15)
- สัญญาณถี่ เห็นจังหวะเข้าละเอียด SL แคบ
- มีสัญญาณรบกวน (Noise) มาก ราคาแกว่งไปมาแบบไม่มีความหมาย
- ต้นทุนสเปรดคิดเป็นสัดส่วนสูงเมื่อเทียบกับเป้า
- ต้องเฝ้าจอ และตัดสินใจเร็ว เหนื่อยทางใจ
ไทม์เฟรมกลาง (H1–H4)
- สมดุลระหว่างจำนวนสัญญาณกับคุณภาพ
- เหมาะกับคนทำงานที่เช็กกราฟได้เป็นช่วง ๆ
ไทม์เฟรมใหญ่ (D1 ขึ้นไป)
- สัญญาณน้อย แนวโน้มชัด Noise น้อย
- SL กว้าง ต้องใช้ล็อตเล็ก และต้องถือไม้ข้ามคืน (มีสวอป)
- ต้องอดทนรอเป็นวันหรือเป็นสัปดาห์
ไม่มีไทม์เฟรมไหนดีที่สุด มีแต่ไทม์เฟรมที่เหมาะกับคุณที่สุด
ไทม์เฟรมกับขนาดไม้
ไทม์เฟรมใหญ่ไม่ได้แปลว่าเสี่ยงมาก ถ้าคุณปรับล็อตให้ถูก ความเสี่ยงเป็นเงินต่อไม้จะเท่ากันได้ ไม่ว่าจะเทรดไทม์เฟรมไหน
บัญชี $2,000 ยอมเสีย 1% ต่อไม้ = $20 เทรดทอง M15: สมมติ SL อยู่ห่าง $4 → ล็อต = 20 ÷ (4 × $100) = 0.05 ล็อต H4: สมมติ SL อยู่ห่าง $20 → ล็อต = 20 ÷ (20 × $100) = 0.01 ล็อต ถ้าทั้งสองไม้โดน SL เสียเท่ากัน $20 แต่ถ้าบัญชีนี้ต้องการ SL ห่าง $40 บน D1 → ล็อต = 20 ÷ 4,000 = 0.005 ซึ่งต่ำกว่า 0.01 ล็อตขั้นต่ำ แปลว่าพอร์ตเล็กอาจเทรด D1 ที่ความเสี่ยง 1% ไม่ได้ ต้องยอมเสี่ยงมากขึ้น (0.01 ล็อต = $40 = 2%) หรือรอ
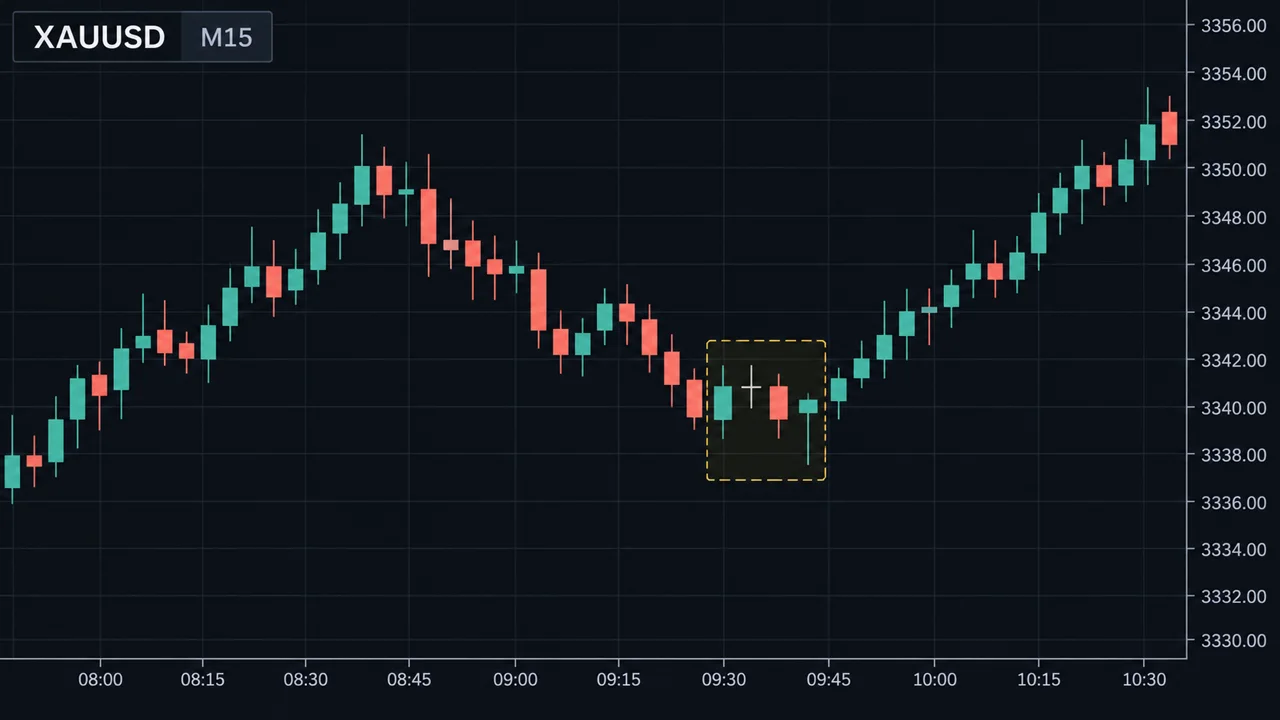
ดูภาพด้านล่าง
นี่คือเหตุผลที่พอร์ตเล็กมักถูกผลักไปเทรดไทม์เฟรมเล็ก ไม่ใช่เพราะไทม์เฟรมเล็กดีกว่า แต่เพราะขนาดล็อตขั้นต่ำบังคับ
ใช้หลายไทม์เฟรมร่วมกัน
วิธีที่นิยมคือใช้สองถึงสามไทม์เฟรม แต่ละตัวมีหน้าที่ชัด:
- ไทม์เฟรมใหญ่ ดูทิศทางหลักและแนวรับแนวต้านสำคัญ เช่น H4 หรือ D1
- ไทม์เฟรมหลัก หาจุดที่น่าสนใจ เช่น H1
- ไทม์เฟรมเล็ก หาจังหวะเข้า เช่น M15
หลักที่ใช้กันทั่วไปคือให้แต่ละระดับห่างกันประมาณ 4–6 เท่า เช่น D1 → H4 → H1 หรือ H4 → H1 → M15 รายละเอียดดูที่ การวิเคราะห์หลายไทม์เฟรม
เลือกไทม์เฟรมหลักของตัวเอง
ถามตัวเองสามข้อ:
- มีเวลาดูกราฟวันละกี่ครั้ง ดูได้แค่เช้าเย็น → H4/D1 · ว่างช่วงเย็นต่อเนื่องสองชั่วโมง → M15/H1
- รับความกดดันได้แค่ไหน ถ้าตัดสินใจเร็วแล้วเครียด ไทม์เฟรมเล็กจะทำให้ตัดสินใจแย่
- พอร์ตใหญ่แค่ไหน ดูตัวอย่างด้านบนว่าล็อตขั้นต่ำยอมให้ใช้ SL กว้างแค่ไหน
เลือกแล้วยึดไว้อย่างน้อยหลายสิบไม้ ก่อนตัดสินว่าใช้ได้หรือไม่
จุดอ่อน / ข้อผิดพลาดที่พบบ่อย
- กระโดดไทม์เฟรมหาเหตุผล ไม้ขาดทุนบน M15 แล้วเปิด H4 หาเหตุผลว่า "ยังถือต่อได้" แผนเปลี่ยนกลางทาง
- ดูหลายไทม์เฟรมมากเกินไป เปิดหกกราฟ เห็นสัญญาณขัดกันตลอด ไม่กล้าเข้าสักไม้
- ใช้ SL ของไทม์เฟรมเล็กกับไอเดียของไทม์เฟรมใหญ่ วิเคราะห์ D1 แต่วาง SL แคบแบบ M5 โดนกวาดง่าย
- คิดว่าไทม์เฟรมเล็กรวยเร็วกว่า สัญญาณถี่ขึ้นแปลว่าขาดทุนถี่ขึ้นได้เท่ากัน และต้นทุนสูงกว่า
- เวลาเซิร์ฟเวอร์ทำให้แท่ง D1 ต่างกัน แต่ละโบรกตัดวันคนละเวลา แท่งรายวันจึงหน้าตาไม่เหมือนกัน
ใช้บนมือถือ
ในแอป MT4/MT5 แตะไอคอนนาฬิกาหรือแถบเหนือกราฟเพื่อสลับไทม์เฟรม แต่จอเล็กทำให้สลับไปมาแล้วหลงได้ง่าย วิธีที่ช่วยได้คือเปิดกราฟเดียวกันไว้หลายหน้าต่าง หน้าต่างละไทม์เฟรม (MT5 มือถือรองรับหลายกราฟ) และตั้งชื่อในใจว่าแต่ละหน้าต่างมีหน้าที่อะไร
สรุป
- ไทม์เฟรมคือระยะเวลาของแท่งหนึ่งแท่ง ยิ่งใหญ่ยิ่งเห็นภาพรวม Noise น้อยลง
- ไทม์เฟรมเล็กสัญญาณถี่ SL แคบ แต่ต้นทุนและความเครียดสูง
- ปรับล็อตให้ความเสี่ยงเป็นเงินเท่ากันทุกไทม์เฟรม
- พอร์ตเล็กอาจใช้ SL กว้างของไทม์เฟรมใหญ่ไม่ได้เพราะล็อตขั้นต่ำ
- ใช้สองถึงสามไทม์เฟรมที่มีหน้าที่ชัด และไม่เปลี่ยนแผนกลางไม้
The same chart can tell different stories on different timeframes. M5 may be rallying while D1 is in a clear downtrend. Choosing a timeframe is not just taste: it decides how long you sit at the screen, how wide your stop is, and how much costs eat into profit.
What a timeframe is
A timeframe is how much time one candle covers. MT4/MT5's main set:
| Code | One candle = | Candles per 24 hours |
|---|---|---|
| M1 / M5 / M15 | 1 / 5 / 15 minutes | 1,440 / 288 / 96 |
| H1 | 1 hour | 24 |
| H4 | 4 hours | 6 |
| D1 | 1 day | 1 |
| W1 / MN | 1 week / 1 month | — |
The same data gets squeezed into fewer candles as the timeframe grows. One H1 candle is twelve M5 candles combined: its open is the first M5 open and its close is the last M5 close.
Small versus large timeframes
Small timeframes (M1–M15)
- Frequent signals, fine entries, tight stops.
- Lots of noise — price wiggles without meaning.
- The spread is a large share of each target.
- You must watch the screen and decide fast, which is mentally tiring.
Middle timeframes (H1–H4)
- A balance between number of signals and quality.
- Suit people with jobs who can check the chart at intervals.
Large timeframes (D1 and above)
- Few signals, clearer trends, less noise.
- Wide stops, so small lots, and trades held overnight (swap).
- Patience measured in days or weeks.
No timeframe is best. There is only the one that fits you best.
Timeframes and trade size
A larger timeframe does not mean more risk. If you size correctly, your dollar risk per trade can be identical on any timeframe.
$2,000 account risking 1% per trade = $20, trading gold. M15: suppose the stop is $4 away → lots = 20 ÷ (4 × $100) = 0.05 lot H4: suppose the stop is $20 away → lots = 20 ÷ (20 × $100) = 0.01 lot If either trade is stopped out, the loss is the same $20. But if a D1 setup needs a stop $40 away → lots = 20 ÷ 4,000 = 0.005, below the 0.01 minimum lot. So a small account may not be able to trade D1 at 1% risk; it must accept more risk (0.01 lot = $40 = 2%) or pass.
See the chart below.
This is why small accounts often get pushed towards small timeframes — not because small timeframes are better, but because the minimum lot size forces it.
Using several timeframes together
A popular approach uses two or three timeframes, each with a clear job:
- Higher timeframe — the main direction and major support/resistance, e.g. H4 or D1.
- Main timeframe — finding interesting areas, e.g. H1.
- Lower timeframe — timing the entry, e.g. M15.
A common rule of thumb is a factor of about 4–6 between levels: D1 → H4 → H1, or H4 → H1 → M15. More in Multi-Timeframe Analysis.
Choosing your main timeframe
Ask yourself three questions:
- How often can you look at a chart? Only morning and evening → H4/D1. Two uninterrupted hours in the evening → M15/H1.
- How well do you handle pressure? If fast decisions stress you, small timeframes will make your decisions worse.
- How big is your account? See the example above for how wide a stop the minimum lot allows.
Once chosen, stick with it for at least several dozen trades before judging it.
Weaknesses / common mistakes
- Timeframe-hopping for excuses. A losing M15 trade, then opening H4 to find a reason to "hold on". The plan changed mid-trade.
- Watching too many timeframes. Six charts, constantly conflicting signals, and you never take a trade.
- Using a small-timeframe stop for a large-timeframe idea. A D1 analysis with an M5-tight stop gets swept easily.
- Thinking small timeframes make money faster. More signals also means more losses, plus higher costs.
- Server time changes the D1 candle. Brokers cut the day at different times, so daily candles look different between them.
On a phone
In MT4/MT5, tap the clock icon or the bar above the chart to switch timeframes — but on a small screen it is easy to get lost switching back and forth. It helps to open the same symbol in several chart windows, one per timeframe (MT5 mobile supports multiple charts), and decide what job each window has.
Summary
- A timeframe is the time one candle covers; larger ones show the big picture with less noise.
- Small timeframes give frequent signals and tight stops, but higher costs and stress.
- Size trades so dollar risk is the same on any timeframe.
- Small accounts may not afford large-timeframe stops because of the minimum lot.
- Use two or three timeframes with clear jobs, and do not change plan mid-trade.

