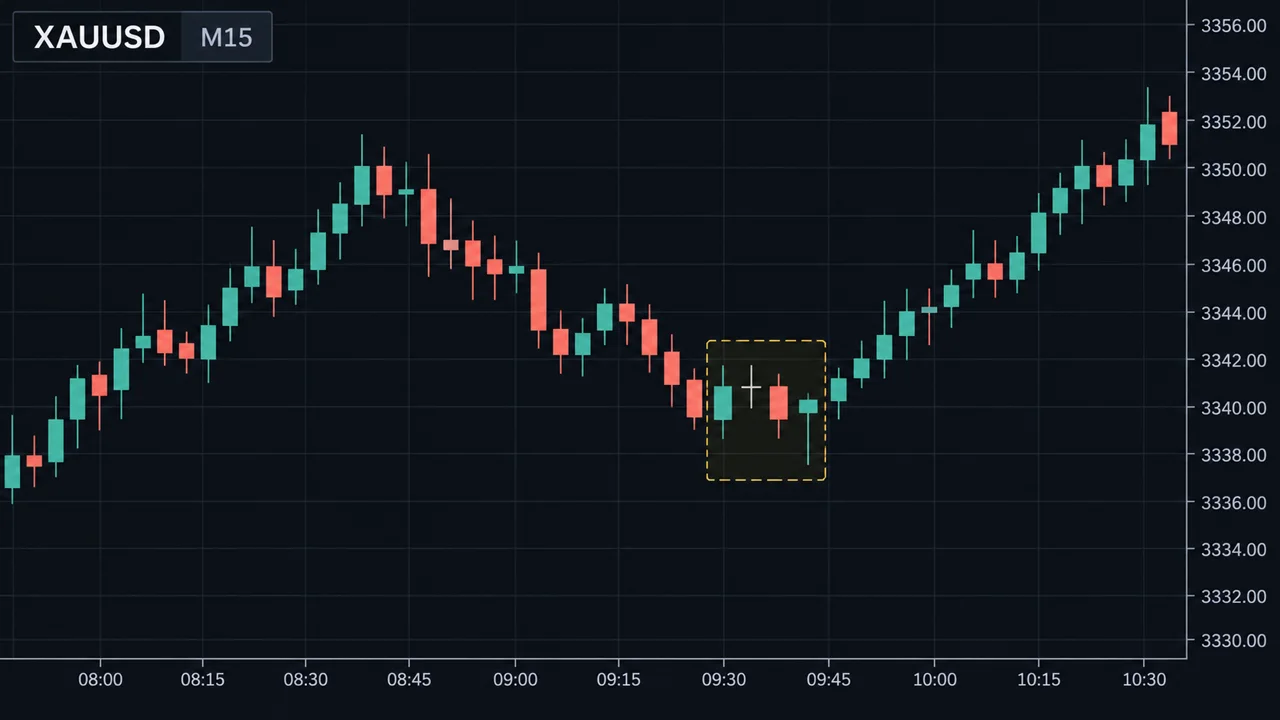
การวิเคราะห์หลายไทม์เฟรม (Multi-Timeframe Analysis)Multi-Timeframe Analysis
ใช้ไทม์เฟรมใหญ่หาทิศ ไทม์เฟรมกลางหาโซน ไทม์เฟรมเล็กหาจังหวะเข้า เพื่อได้ SL สั้นลงโดยไม่ทิ้งภาพใหญ่Use a higher timeframe for direction, a middle one for zones and a lower one for timing, to get tighter stops without losing the big picture.

In this article · 5
การวิเคราะห์หลายไทม์เฟรม (Multi-Timeframe Analysis) คือการดูกราฟเดียวกันในหลายกรอบเวลา เพื่อให้ได้ทั้ง "ภาพใหญ่" และ "จังหวะเข้า" ในเวลาเดียวกัน ปัญหาที่หลายคนเจอคือ ถ้าดูแค่ไทม์เฟรมใหญ่ SL จะไกลจนต้องใช้ล็อตเล็กมาก ถ้าดูแค่ไทม์เฟรมเล็ก จะหลงทิศและเทรดสวนแรงหลักโดยไม่รู้ตัว การใช้หลายไทม์เฟรมอย่างมีระบบช่วยแก้ทั้งสองปัญหา
หลักการ 3 ชั้น
วิธีที่นิยมคือแบ่งหน้าที่ให้ไทม์เฟรม 3 ระดับ
| ชั้น | หน้าที่ | ตัวอย่าง (สวิง) | ตัวอย่าง (เดย์เทรด) |
|---|---|---|---|
| ใหญ่ | หาทิศและโครงสร้าง | D1 | H4 |
| กลาง | หาโซน แนวรับแนวต้าน | H4 | H1 |
| เล็ก | หาจังหวะเข้าและวาง SL | H1 | M15 |
กฎง่าย ๆ ในการเลือก คือไทม์เฟรมแต่ละชั้นห่างกันประมาณ 4–6 เท่า เช่น D1 → H4 (6 เท่า) → H1 (4 เท่า) ถ้าห่างน้อยเกินไป ทุกชั้นจะบอกเรื่องเดียวกัน ถ้าห่างมากเกินไป เช่น D1 กับ M5 ภาพจะไม่เชื่อมกัน
ขั้นตอนใช้งาน
- ไทม์เฟรมใหญ่ ตอบว่าซื้อหรือขาย ดู โครงสร้างราคา ถ้าเป็น HH/HL ให้มองหาแต่ฝั่งซื้อ ถ้าไม่ชัด ให้ลดความเสี่ยงหรือไม่เทรด
- ไทม์เฟรมกลาง ตอบว่าที่ไหน วาดโซนแนวรับ โซนดีมานด์ หรือเส้นแนวโน้มที่ราคาน่าจะย่อลงไปหา จดไว้ล่วงหน้า
- รอราคาเข้าโซน ระหว่างนี้ไม่ต้องทำอะไร ตั้งการแจ้งเตือนแล้วรอ
- ไทม์เฟรมเล็ก ตอบว่าเมื่อไหร่ เมื่อราคาเข้าโซน ดูไทม์เฟรมเล็กหาสัญญาณ เช่น โครงสร้างเล็กเปลี่ยนเป็นขาขึ้น (เกิด HH แรก) แท่ง Engulfing หรือ Pin Bar ดู สัญญาณเข้าเทรด
- วาง SL ตามไทม์เฟรมเล็ก แต่ TP ตามไทม์เฟรมกลาง นี่คือหัวใจของการได้ RR ที่ดี
ถ้า M15 บอกขาลงแต่ H4 บอกขาขึ้น ให้ถือว่าขาลงบน M15 คือ "การย่อ" ของขาขึ้น ไม่ใช่เทรนด์ใหม่ จนกว่าโครงสร้าง H4 จะเปลี่ยนจริง
สมมติบัญชี $5,000 ยอมเสีย 1% = $50 ต่อไม้ H4 เป็นขาขึ้น มีโซนดีมานด์ H1 ที่ 1,940–1,944 และแนวต้าน H4 ถัดไปที่ 1,975 วิธี A: ใช้ H4 อย่างเดียว รอแท่ง H4 กลับตัวปิดที่ 1,950 SL ใต้จุดต่ำ H4 ที่ 1,930 = 20 ดอลลาร์ ล็อต = 50 ÷ (20 × 100) = 0.025 → ปัดลงเป็น 0.02 (ขั้นล็อตขั้นต่ำ 0.01) ความเสี่ยงจริง 0.02 × 20 × 100 = $40 เป้า 1,975 = 25 ดอลลาร์ → 0.02 × 25 × 100 = $50 RR = 1.25 วิธี B: ใช้ M15 หาจังหวะ ราคาเข้าโซน H1 แล้ว M15 เกิด Engulfing ซื้อที่ 1,945 SL ใต้จุดต่ำ M15 ที่ 1,938 = 7 ดอลลาร์ ล็อต = 50 ÷ (7 × 100) ≈ 0.071 → ปัดลงเป็น 0.07 ความเสี่ยงจริง 0.07 × 7 × 100 = $49 เป้าเดิม 1,975 = 30 ดอลลาร์ → 0.07 × 30 × 100 = $210 RR ≈ 4.29 ความเสี่ยงเป็นเงินใกล้กัน แต่วิธี B มีเป้าใหญ่กว่ามาก ข้อแลกเปลี่ยนคือ SL ที่สั้นกว่าจะโดนตัดบ่อยกว่า
ดูภาพด้านล่าง ตัวอย่างนี้วาดเป็นกราฟทั้งสองวิธี และเทียบ RR
จุดอ่อน / ข้อผิดพลาดที่พบบ่อย
- SL สั้นโดนบ่อย การใช้ไทม์เฟรมเล็กวาง SL ทำให้ RR ต่อไม้ดูดี แต่อัตราชนะมักต่ำลง ผลรวมจะคุ้มหรือไม่ต้องทดสอบเอง ดู Risk:Reward กับอัตราชนะ
- ดูหลายไทม์เฟรมจนสับสน เปิด 6–7 ไทม์เฟรมแล้วแต่ละอันบอกคนละอย่าง สุดท้ายเลือกเชื่ออันที่ตรงกับใจ ใช้ 3 ชั้นพอ
- ใช้ไทม์เฟรมเล็กเป็นข้ออ้างสวนเทรนด์ "M5 กลับตัวแล้ว" ไม่ได้แปลว่าเทรนด์ H4 จบ
- ไม่ได้กำหนดชั้นล่วงหน้า วันนี้ใช้ H4-H1-M15 พรุ่งนี้ใช้ D1-M30-M1 ทำให้วัดผลไม่ได้ เลือกชุดเดียวแล้วใช้ซ้ำ
- ลืมสเปรดบนไทม์เฟรมเล็ก SL 7 ดอลลาร์บนทองกับสเปรดกว้างช่วงตลาดเงียบ สัดส่วนสเปรดต่อ SL สูงขึ้นมาก ดู สเปรด สวอป ค่าคอมมิชชัน
- การวิเคราะห์หลายไทม์เฟรมช่วยให้การตัดสินใจเป็นระบบขึ้น แต่ไม่ได้ทำให้คาดการณ์ราคาได้แม่นยำ
ใช้บนมือถือ
บน MT4/MT5 มือถือ สลับไทม์เฟรมได้จากแถบด้านบนของกราฟ เส้นและโซนที่วาดไว้จะแสดงทุกไทม์เฟรม (ถ้าไม่ได้ตั้งให้ซ่อน) วิธีที่ใช้ได้ดีคือ วาดโซนบนไทม์เฟรมกลางตอนเช้า ตั้งการแจ้งเตือนที่ขอบโซน แล้วเปิดไทม์เฟรมเล็กเฉพาะตอนแจ้งเตือนดัง บนแท็บเล็ตหรือแอปที่แบ่งหน้าจอได้ อาจเปิดสองไทม์เฟรมพร้อมกัน
สรุป
- แบ่งหน้าที่ 3 ชั้น ใหญ่หาทิศ กลางหาโซน เล็กหาจังหวะ ห่างกันประมาณ 4–6 เท่า
- เมื่อขัดกัน ไทม์เฟรมใหญ่ชนะ ไทม์เฟรมเล็กเป็นแค่การย่อหรือเด้ง
- SL ตามไทม์เฟรมเล็ก TP ตามไทม์เฟรมกลาง คือที่มาของ RR ที่ดี
- SL สั้นโดนบ่อยขึ้น ต้องทดสอบว่าผลรวมคุ้มหรือไม่
- เลือกชุดไทม์เฟรมเดียวแล้วใช้ซ้ำ จะวัดผลได้
Multi-timeframe analysis means looking at the same market on several timeframes so you get both the big picture and the timing. Many traders run into one of two problems: watch only a higher timeframe and the stop is so far that the lot must be tiny; watch only a lower timeframe and you lose direction and fight the main move without realising it. A structured multi-timeframe routine solves both.
The three-layer approach
A common method gives each of three timeframes a job:
| Layer | Job | Swing example | Day-trade example |
|---|---|---|---|
| Higher | Direction and structure | D1 | H4 |
| Middle | Zones, support and resistance | H4 | H1 |
| Lower | Timing and stop placement | H1 | M15 |
A simple rule for choosing them: keep each layer about 4–6 times apart, such as D1 → H4 (6×) → H1 (4×). Too close and every layer says the same thing; too far apart, like D1 with M5, and the pictures don't connect.
How to use it
- Higher timeframe: buy or sell? Read market structure. If it is HH/HL, look only for buys. If it is unclear, reduce risk or stay out.
- Middle timeframe: where? Draw support, demand zones or trendlines that price is likely to pull back into. Note them in advance.
- Wait for price to reach the zone. Do nothing meanwhile. Set an alert and wait.
- Lower timeframe: when? Once price is in the zone, look for a trigger on the lower timeframe: small structure turning up (the first higher high), an engulfing bar or a pin bar. See entry triggers.
- Stop from the lower timeframe, target from the middle one. This is where good reward-to-risk comes from.
If M15 is falling but H4 is rising, treat the M15 decline as a pullback in the uptrend, not a new trend, until H4 structure actually changes.
Suppose a $5,000 account risks 1% = $50 per trade. H4 is in an uptrend, there is an H1 demand zone at 1,940–1,944, and the next H4 resistance is 1,975. Method A: H4 only. Wait for an H4 reversal candle closing at 1,950; stop below the H4 low at 1,930 = $20. Lot = 50 ÷ (20 × 100) = 0.025 → round down to 0.02 (lot step 0.01). Actual risk 0.02 × 20 × 100 = $40. Target 1,975 = $25 → 0.02 × 25 × 100 = $50. R:R = 1.25. Method B: M15 for timing. Price enters the H1 zone and M15 prints an engulfing bar. Buy 1,945, stop below the M15 low at 1,938 = $7. Lot = 50 ÷ (7 × 100) ≈ 0.071 → round down to 0.07. Actual risk 0.07 × 7 × 100 = $49. Same target 1,975 = $30 → 0.07 × 30 × 100 = $210. R:R ≈ 4.29. The dollar risk is similar, but method B has a much larger target. The trade-off: the tighter stop gets hit more often.
See the charts below: both methods drawn out, and their R:R side by side.
Weaknesses and common mistakes
- Tight stops get hit more. Lower-timeframe stops make R:R per trade look great, but the win rate usually drops. Whether the total works out is something you must test. See risk:reward and win rate.
- Too many timeframes. Open six or seven and each says something different; you end up believing the one that agrees with you. Three layers are enough.
- Using the lower timeframe to justify fighting the trend. "M5 has reversed" does not mean the H4 trend is over.
- No fixed set. H4-H1-M15 today, D1-M30-M1 tomorrow makes your results impossible to measure. Pick one set and repeat it.
- Forgetting spread on low timeframes. A $7 stop on gold during a wide-spread quiet period means spread is a much bigger share of the stop. See spread, swap and commission.
- Multi-timeframe analysis makes decisions more systematic; it does not make price predictable.
On a phone
In MT4/MT5 mobile, switch timeframes from the bar at the top of the chart. Lines and zones you draw show on every timeframe unless you hide them. A practical routine: draw zones on the middle timeframe in the morning, set alerts at the zone edges, and open the lower timeframe only when an alert fires. On a tablet or with split-screen apps you can show two timeframes side by side.
Summary
- Three layers: higher for direction, middle for zones, lower for timing, about 4–6× apart.
- When they disagree, the higher timeframe wins; the lower one is a pullback or bounce.
- Stop from the lower timeframe, target from the middle one: that's where good R:R comes from.
- Tighter stops get hit more often; test whether the total works.
- Pick one timeframe set and repeat it so you can measure results.