พื้นฐานแท่งเทียน (Candlestick) อ่านกราฟให้เป็นCandlestick Basics
อ่านแท่งเทียนหนึ่งแท่งให้ออกว่าเกิดอะไรขึ้นในช่วงเวลานั้น ใครชนะระหว่างฝั่งซื้อกับฝั่งขาย และใช้ข้อมูลนี้วาง SL ได้อย่างไรRead a single candle to see what happened in that period, who won between buyers and sellers, and how to use it for stop placement.
ในบทความนี้ · 8
In this article · 8
แท่งเทียน (Candlestick) คือวิธีแสดงราคาที่นักเทรดส่วนใหญ่ใช้ เพราะแท่งเดียวบอกข้อมูลได้ถึงสี่ตัว และเมื่ออ่านคล่องแล้ว คุณจะเห็น "เรื่องราว" ของการต่อสู้ระหว่างฝั่งซื้อกับฝั่งขายในแต่ละช่วงเวลา บทนี้ปูพื้นฐานการอ่านแท่งเดียวให้แน่นก่อนไปเรียนรูปแบบแท่งเทียนที่ซับซ้อนขึ้น
แท่งเทียนหนึ่งแท่งบอกอะไร
แต่ละแท่งแทนช่วงเวลาหนึ่งตามไทม์เฟรม (Timeframe) ที่เลือก เช่น แท่ง H1 คือหนึ่งชั่วโมง และมีข้อมูลสี่ตัว เรียกรวมว่า OHLC:
- Open (ราคาเปิด) ราคาแรกของช่วงเวลานั้น
- High (ราคาสูงสุด) ราคาสูงสุดที่ไปถึง
- Low (ราคาต่ำสุด) ราคาต่ำสุดที่ไปถึง
- Close (ราคาปิด) ราคาสุดท้ายเมื่อหมดเวลา
ส่วนประกอบของแท่ง
- ตัวแท่ง (Body) ช่วงระหว่าง Open กับ Close
- ไส้บน (Upper Wick / Shadow) จากขอบบนของตัวแท่งถึง High
- ไส้ล่าง (Lower Wick) จากขอบล่างของตัวแท่งถึง Low
- สี แท่งขึ้น (Bullish) คือ Close สูงกว่า Open มักเป็นสีเขียวหรือขาว แท่งลง (Bearish) คือ Close ต่ำกว่า Open มักเป็นสีแดงหรือดำ สีตั้งค่าเปลี่ยนได้ อย่ายึดติดกับสี ให้ดูว่าปิดสูงหรือต่ำกว่าเปิด
แท่งหนึ่ง: Open 2,000 · High 2,012 · Low 1,995 · Close 2,008 (แท่งขึ้น) ตัวแท่ง = 2,008 − 2,000 = $8 ไส้บน = 2,012 − 2,008 = $4 ไส้ล่าง = 2,000 − 1,995 = $5 ช่วงทั้งแท่ง (Range) = 2,012 − 1,995 = $17 ตัวแท่งคิดเป็น 8 ÷ 17 ≈ 47% ของทั้งแท่ง
อ่านเรื่องราวจากรูปร่าง
ลองอ่านแท่งในตัวอย่าง: ช่วงต้นชั่วโมงราคาถูกกดลงไปถึง 1,995 แต่ฝั่งซื้อดันกลับขึ้นจนสูงสุด 2,012 แล้วถูกขายย่อลงมาปิดที่ 2,008 สรุปคือฝั่งซื้อชนะในชั่วโมงนี้ แต่ไม่ได้ชนะขาด
แนวทางอ่านแบบง่าย:
- ตัวแท่งยาว ไส้สั้น ฝั่งหนึ่งคุมเกมตลอดช่วงเวลา แรงมีทิศทางชัด
- ตัวแท่งเล็ก ไส้ยาวทั้งสองด้าน ทั้งสองฝั่งสู้กัน ยังไม่มีใครชนะ ตลาดลังเล
- ไส้ล่างยาว ปิดใกล้ High ราคาถูกกดลงแต่ถูกซื้อกลับ บอกว่ามีแรงซื้อรออยู่ด้านล่าง
- ไส้บนยาว ปิดใกล้ Low ราคาถูกดันขึ้นแต่ถูกขายกลับ บอกว่ามีแรงขายรออยู่ด้านบน
- โดจิ (Doji) Open กับ Close แทบเท่ากัน แสดงความลังเล
สิ่งสำคัญคือ แท่งเดียวไม่มีความหมายถ้าไม่ดูบริบท แท่งไส้ล่างยาวที่แนวรับสำคัญมีน้ำหนักกว่าแท่งเดียวกันที่อยู่กลางกรอบราคามาก
ใช้แท่งเทียนวาง SL
ราคาสูงสุดและต่ำสุดของแท่งเป็นจุดที่ "ตลาดเคยปฏิเสธ" จึงนิยมใช้วาง SL เช่น ไม้ซื้อวาง SL ใต้ Low ของแท่งสัญญาณ บวกระยะเผื่อเล็กน้อยสำหรับสเปรด
ใช้แท่งเดิม คุณซื้อที่ราคาปิด 2,008 วาง SL ใต้ Low 1,995 เผื่ออีก $1 = 1,994 ระยะ SL = 2,008 − 1,994 = $14 บัญชี $5,000 ยอมเสีย 1% = $50 ล็อต = 50 ÷ (14 × $100) = 0.0357 → ปัดลงเป็น 0.03 ล็อต ความเสี่ยงจริง = 14 × $100 × 0.03 = $42 (ต่ำกว่า $50 เพราะปัดลง ซึ่งถูกต้องแล้ว)
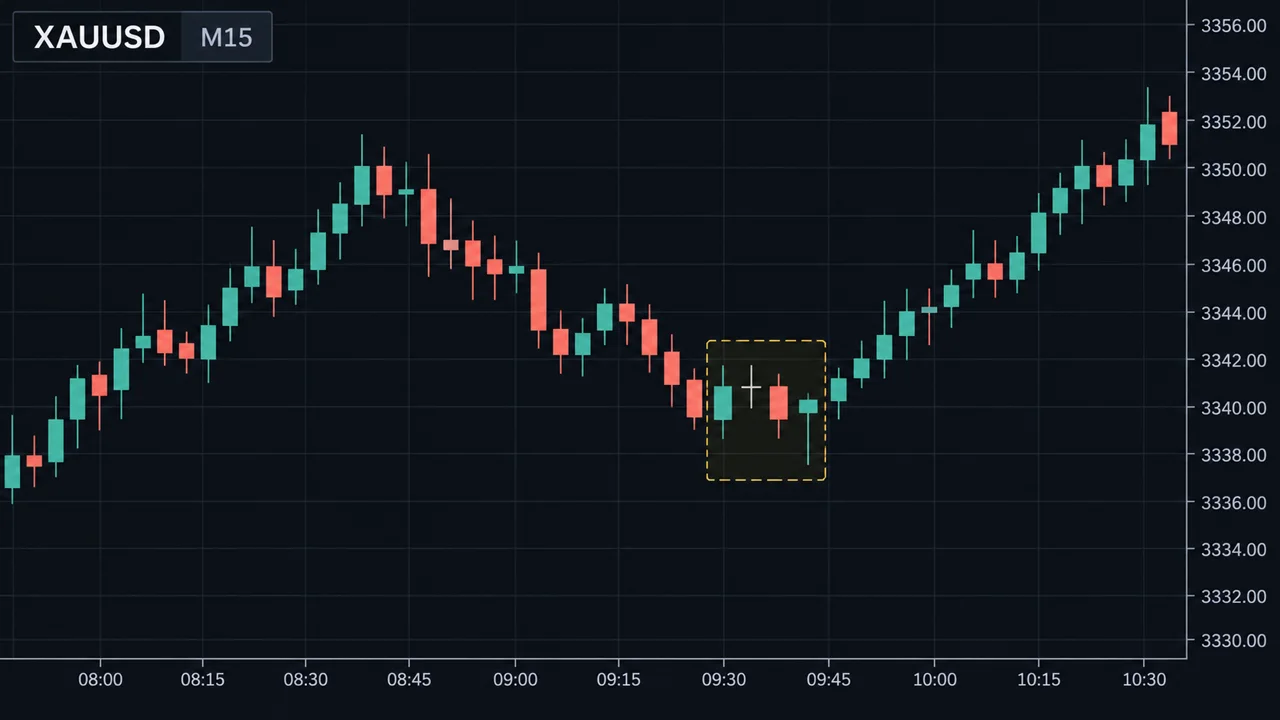
ดูภาพด้านล่าง
รอให้แท่งปิดก่อน
แท่งที่ยังไม่ปิดเปลี่ยนรูปได้ตลอด แท่งที่ดูเหมือนไส้ล่างยาวสวย ๆ ตอนนาทีที่ 40 อาจกลายเป็นแท่งลงตัวยาวตอนนาทีที่ 59 การตัดสินใจจากแท่งที่ยังวิ่งอยู่จึงเสี่ยงต่อสัญญาณหลอก นักเทรดส่วนใหญ่ที่ใช้แท่งเทียนจึงรอให้แท่งปิดก่อนเสมอ
จุดอ่อน / ข้อผิดพลาดที่พบบ่อย
- อ่านแท่งเดียวโดยไม่ดูบริบท แท่งที่เหมือนกันมีความหมายต่างกันตามตำแหน่งและแนวโน้ม
- เข้าไม้ก่อนแท่งปิด รูปแท่งเปลี่ยนได้จนวินาทีสุดท้าย
- ลืมว่าไทม์เฟรมเปลี่ยนเรื่องราว แท่ง H1 ไส้ล่างยาว อาจเป็นแค่ส่วนหนึ่งของแท่ง H4 ที่เป็นแท่งลง
- เชื่อว่ารูปแบบแท่งเทียนทำนายอนาคตได้แน่นอน แท่งเทียนบอกสิ่งที่ "เกิดไปแล้ว" ไม่ได้รับประกันสิ่งที่จะเกิด
- ราคาต่างกันระหว่างโบรก ตลาด OTC ทำให้ High/Low ของแต่ละโบรกต่างกันเล็กน้อย ไส้ที่เห็นบนกราฟคุณอาจไม่ตรงกับคนอื่นเป๊ะ
- วาง SL ตรงปลายไส้พอดี ไม่เผื่อสเปรด จึงโดนกวาดง่าย
ใช้บนมือถือ
ในแอป MT4/MT5 หมุนจอแนวนอนเพื่อให้แท่งกว้างขึ้น และใช้เครื่องมือเป้าเล็ง (Crosshair) แตะค้างบนแท่งเพื่ออ่าน OHLC ของแท่งนั้น บน TradingView มือถือ แตะที่แท่งแล้วตัวเลข OHLC จะขึ้นที่มุมบนซ้าย ฝึกอ่านค่าสี่ตัวนี้จนคล่องก่อนจะไปดูรูปแบบที่ซับซ้อน
สรุป
- แท่งเทียนหนึ่งแท่งมีข้อมูลสี่ตัว: Open, High, Low, Close
- ตัวแท่งบอกว่าใครชนะ ไส้บอกว่าราคาถูกปฏิเสธที่ไหน
- อ่านแท่งเดียวในบริบทของแนวรับแนวต้านและแนวโน้มเสมอ
- รอแท่งปิดก่อนตัดสินใจ
- High/Low ของแท่งใช้เป็นจุดอ้างอิงวาง SL ได้ แต่ต้องเผื่อสเปรด
Candlesticks are how most traders view price, because a single candle carries four pieces of information. Once you read them fluently, you see the "story" of the fight between buyers and sellers in each period. This lesson builds a solid foundation in reading a single candle before you move on to more complex patterns.
What one candle tells you
Each candle covers one period of your chosen timeframe — an H1 candle is one hour — and holds four values, known as OHLC:
- Open — the first price of the period.
- High — the highest price reached.
- Low — the lowest price reached.
- Close — the last price when the period ends.
Parts of a candle
- Body — the area between open and close.
- Upper wick (shadow) — from the top of the body to the high.
- Lower wick — from the bottom of the body to the low.
- Colour — a bullish candle closes above its open, usually green or white; a bearish candle closes below its open, usually red or black. Colours are configurable, so do not rely on them — check whether the close is above or below the open.
One candle: open 2,000 · high 2,012 · low 1,995 · close 2,008 (bullish). Body = 2,008 − 2,000 = $8 Upper wick = 2,012 − 2,008 = $4 Lower wick = 2,000 − 1,995 = $5 Full range = 2,012 − 1,995 = $17 The body is 8 ÷ 17 ≈ 47% of the whole candle.
Reading the story from the shape
Read the candle above: early in the hour, price was pushed down to 1,995, but buyers drove it back up to a high of 2,012, then sellers pulled it back to close at 2,008. Buyers won the hour, but not decisively.
Simple reading guides:
- Long body, short wicks — one side controlled the whole period; clear directional pressure.
- Small body, long wicks on both sides — both sides fought and nobody won; indecision.
- Long lower wick, close near the high — price was pushed down but bought back; buyers were waiting below.
- Long upper wick, close near the low — price was pushed up but sold back; sellers were waiting above.
- Doji — open and close nearly equal; indecision.
The crucial point: a single candle means little without context. A long lower wick at major support carries far more weight than the same candle in the middle of a range.
Using candles to place a stop
A candle's high and low are levels the market has already rejected, so they are popular stop references. For a buy, place the stop below the signal candle's low, plus a small buffer for the spread.
Using the same candle, you buy at the close of 2,008 and place the stop below the 1,995 low with a $1 buffer = 1,994. Stop distance = 2,008 − 1,994 = $14 $5,000 account risking 1% = $50 Lots = 50 ÷ (14 × $100) = 0.0357 → round down to 0.03 lot Actual risk = 14 × $100 × 0.03 = $42 (below $50 because you rounded down — which is correct).
See the chart below.
Wait for the close
A candle that has not closed can still change shape. What looks like a beautiful long lower wick at minute 40 can become a long bearish candle by minute 59. Acting on a live candle invites false signals, which is why most candlestick traders wait for the close.
Weaknesses / common mistakes
- Reading one candle without context. Identical candles mean different things depending on location and trend.
- Entering before the close. The shape can change until the last second.
- Forgetting that timeframe changes the story. A long-wicked H1 candle may be just part of a bearish H4 candle.
- Believing candle shapes predict the future. Candles describe what has happened; they guarantee nothing about what comes next.
- Prices differ between brokers. In OTC markets each broker's highs and lows differ slightly, so your wick may not match someone else's exactly.
- Putting the stop exactly at the wick tip with no allowance for spread, so it gets swept easily.
On a phone
In MT4/MT5, turn the phone sideways to widen the candles and use the crosshair — long-press a candle — to read its OHLC. In TradingView mobile, tap a candle and the OHLC values appear at the top left. Practise reading these four values until it is effortless before moving on to complex patterns.
Summary
- One candle holds four values: open, high, low and close.
- The body shows who won; the wicks show where price was rejected.
- Always read a candle in the context of support, resistance and trend.
- Wait for the candle to close before acting.
- A candle's high/low is a useful stop reference — with a spread buffer.
