การเทรดข่าว (News Trading)News Trading
เทรดตอนข่าวเศรษฐกิจสำคัญออก สามแนวทางหลัก ทำไมสเปรดกว้างและการลื่นไถลทำให้ SL ไม่ได้ป้องกันเต็มที่ และวิธีจำกัดความเสียหายTrading around major economic releases — the three main approaches, why wider spreads and slippage make stops less protective, and how to limit the damage.

ในบทความนี้ · 7
In this article · 7
การเทรดข่าว (News Trading) คือการเทรดรอบช่วงที่ข่าวเศรษฐกิจสำคัญประกาศ เช่น การจ้างงานนอกภาคเกษตรของสหรัฐฯ (Non-Farm Payrolls หรือ NFP) ดัชนีราคาผู้บริโภค (CPI) หรือการประกาศอัตราดอกเบี้ยของธนาคารกลาง ช่วงเวลาเหล่านี้ราคาอาจวิ่งในไม่กี่นาทีเท่ากับที่ปกติวิ่งทั้งวัน ซึ่งดึงดูดนักเทรด แต่ก็เป็นช่วงที่ต้นทุนการเทรดสูงที่สุดและควบคุมความเสี่ยงยากที่สุดเช่นกัน
ทำไมราคาวิ่งแรงตอนข่าว
ตลาดตั้งราคาตาม "สิ่งที่คาดไว้" ก่อนข่าวออก เมื่อตัวเลขจริงต่างจากที่คาด (Surprise) ตลาดต้องปรับราคาใหม่ทันที ส่วนต่างระหว่างตัวเลขจริงกับค่าคาดการณ์จึงสำคัญกว่าตัวเลขเอง ตัวเลขที่ "ดี" แต่ต่ำกว่าคาดอาจทำให้ค่าเงินอ่อนลงได้ ปฏิทินเศรษฐกิจ (Economic Calendar) แสดงทั้งเวลาประกาศ ค่าคาดการณ์ และค่าก่อนหน้า
ตัวอย่างเวลาที่ควรรู้: NFP มักประกาศวันศุกร์แรกของเดือน เวลา 8:30 ตามเวลานิวยอร์ก ซึ่งตรงกับประมาณ 19:30 เวลาไทยช่วงที่สหรัฐฯ ใช้เวลาฤดูร้อน และประมาณ 20:30 ช่วงเวลาฤดูหนาว (บางเดือนอาจเลื่อน ให้เช็กปฏิทินทุกครั้ง)
สิ่งที่เกิดกับต้นทุนตอนข่าว
- สเปรดกว้างขึ้น: ผู้ให้ราคาถอนคำสั่งก่อนข่าวเพื่อลดความเสี่ยง สเปรดจึงอาจกว้างกว่าปกติหลายเท่าในช่วงไม่กี่วินาทีถึงไม่กี่นาที
- การลื่นไถล (Slippage): คำสั่ง Stop และ SL ทำงานที่ราคาถัดไปที่มีอยู่จริง ไม่ใช่ราคาที่ตั้งไว้ ตอนราคากระโดดอาจห่างกันมาก
- ราคากระโดดข้ามระดับ: ราคาอาจข้ามระดับ SL ไปเลยโดยไม่มีการซื้อขายตรงนั้น
- คำสั่งถูกปฏิเสธหรือช้า: ระบบอาจตอบสนองช้ากว่าปกติ
ดูพื้นฐานต้นทุนเพิ่มที่ สเปรด สวอป และค่าคอมมิชชัน
สามแนวทางหลัก
- ตั้งคำสั่งดักสองฝั่งก่อนข่าว (Straddle): Buy Stop เหนือราคาและ Sell Stop ใต้ราคา ก่อนข่าวไม่กี่นาที ข้อเสียคือสเปรดกว้างและการกระชากสองทางอาจทำให้ทั้งสองฝั่งทำงานและขาดทุนทั้งคู่
- รอให้ฝุ่นจางแล้วเทรดตาม: ไม่เทรดใน 5–15 นาทีแรก รอให้สเปรดกลับปกติ แล้วเทรดตามทิศที่ราคาเลือกหรือรอราคาย่อ (เบรกแล้วรีเทสต์) ช้ากว่าแต่ต้นทุนต่ำกว่ามาก
- เลี่ยงข่าว: ไม่เปิดไม้ใหม่ก่อนและหลังข่าวแรงช่วงหนึ่ง และลดหรือปิดไม้ที่ถืออยู่ นักเทรดสวิงและเดย์เทรดจำนวนมากเลือกแนวทางนี้ เป็นการบริหารความเสี่ยง ไม่ใช่การเสียโอกาส
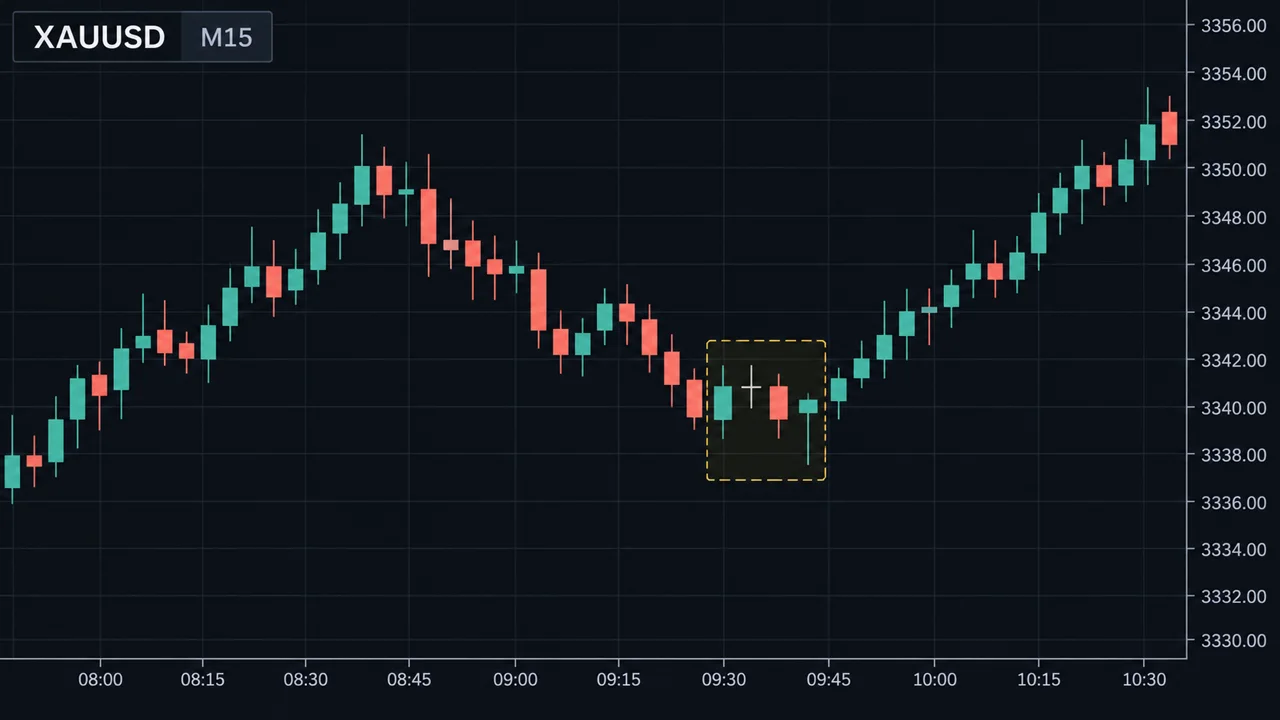
ภาพด้านล่างคือจุดอ่อนของแนวทางที่ 1 เมื่อราคากระชากสองทาง
ทองคำ 0.10 ล็อต (ราคาขยับ $1 = $10) ตั้ง SL ห่าง $5 คาดว่าเสียสูงสุด $50 สมมติตอนข่าวราคาร่วงผ่าน SL แล้วคำสั่งปิดได้ที่ราคาห่างจากที่ตั้งไว้อีก $3 ขาดทุนจริง ($5 + $3) × $10 = $80 มากกว่าที่วางแผน 60% ต้นทุนสเปรด: ถ้าสเปรดปกติคือ $0.30 ต้นทุน $0.30 × $10 = $3 แต่ถ้าตอนข่าวสมมติว่ากว้างเป็น $2.00 ต้นทุนกลายเป็น $2.00 × $10 = $20 ถ้าวางคำสั่งดักสองฝั่งแล้วโดนทั้งสองฝั่งด้วยเงื่อนไขนี้ ความเสียหายอาจเป็น 2 × $80 = $160 จากแผนที่คิดว่าเสี่ยง $50 บทเรียน: ตอนข่าว ให้คำนวณล็อตจาก "ความเสี่ยงที่อาจเกิดจริง" ไม่ใช่จากระยะ SL บนกราฟ
เหมาะกับใคร
- เวลา: ต้องอยู่หน้าจอตรงเวลาประกาศ ซึ่งสำหรับข่าวสหรัฐฯ มักเป็นช่วงค่ำถึงดึกเวลาไทย
- นิสัย: ตัดสินใจเร็ว ทนต่อการเห็นราคากระชากได้โดยไม่ตื่นตระหนก และยอมนั่งดูเฉย ๆ ถ้าสถานการณ์ไม่ชัด
- ขนาดบัญชี: ต้องใช้ล็อตเล็กกว่าปกติ เพราะความเสี่ยงจริงสูงกว่าระยะ SL
- ความรู้: ต้องเข้าใจว่าข่าวแต่ละตัววัดอะไร และตลาดคาดอะไร (การวิเคราะห์ปัจจัยพื้นฐาน) สำหรับทองคำ ดู ปัจจัยขับเคลื่อนราคาทอง
จุดอ่อน / ข้อผิดพลาดที่พบบ่อย
- คิดว่า SL รับประกันราคา: ตอนข่าว SL คือคำสั่งให้ปิดที่ราคาถัดไป ไม่ใช่ราคาที่ตั้ง
- เดาตัวเลข: การเข้าไม้ก่อนข่าวโดยเดาว่าตัวเลขจะดีหรือแย่ คือการพนันกับผลที่ออกมาได้ทั้งสองทาง
- เข้าใจผลผิดทาง: ตลาดอาจตอบสนองต่อส่วนอื่นของรายงาน (เช่น ตัวเลขเดือนก่อนที่ถูกแก้ไข) มากกว่าตัวเลขหลัก ราคาจึงวิ่งสวนความคาดหมายได้
- การกระชากสองทาง (Whipsaw): ราคาวิ่งแรงทางหนึ่งแล้วกลับอีกทางในไม่กี่นาที (เบรกหลอก)
- ลืมไม้ที่ถืออยู่: ไม้สวิงที่ถือข้ามข่าวแรงโดยไม่ได้ตั้งใจ อาจได้รับผลกระทบเต็ม ๆ
- เงื่อนไขของบัญชี: บางบัญชีมีข้อจำกัดการเทรดช่วงข่าว หรือเปลี่ยนมาร์จิ้นช่วงข่าว ควรอ่านเงื่อนไขก่อน
ถ้ายังไม่มีระบบที่ทดสอบแล้วโดยรวมสเปรดและการลื่นไถลแบบช่วงข่าว การเลี่ยงข่าวแรงเป็นทางเลือกที่สมเหตุสมผลที่สุด
ใช้บนมือถือ
การเทรดข่าวบนมือถือมีความเสี่ยงเพิ่ม เพราะเครือข่ายมือถือช้าหรือหลุดได้ในจังหวะสำคัญ ถ้าจะเทรด ให้ใช้คำสั่งรอที่ตั้งไว้ล่วงหน้าพร้อม SL ทุกคำสั่ง แต่สำหรับคนส่วนใหญ่ การใช้มือถือเพื่อเช็กปฏิทินข่าวประจำสัปดาห์ แล้วตั้งการแจ้งเตือนก่อนข่าวแรง เพื่อจัดการไม้ที่ถืออยู่ เป็นการใช้งานที่มีประโยชน์กว่า
สรุป
- ข่าวทำให้ราคาวิ่งแรงเพราะตัวเลขต่างจากที่ตลาดคาด
- ตอนข่าว สเปรดกว้าง การลื่นไถลสูง และ SL ไม่ได้รับประกันราคา
- แนวทางหลัก: ดักสองฝั่ง รอแล้วตาม หรือเลี่ยงข่าว
- คำนวณล็อตจากความเสี่ยงที่อาจเกิดจริง ไม่ใช่ระยะ SL บนกราฟ
- เช็กปฏิทินข่าวทุกสัปดาห์ แม้จะไม่ได้เทรดข่าวก็ตาม
News trading means trading around major economic releases such as US Non-Farm Payrolls (NFP), the Consumer Price Index (CPI), or central bank rate decisions. Around these moments price can move in a few minutes as far as it normally moves all day. That attracts traders — but it is also when trading costs are highest and risk is hardest to control.
Why price moves so hard on news
Before a release, the market prices in what it expects. When the actual number differs from the forecast — a surprise — the market has to reprice at once. The gap between actual and forecast matters more than the number itself: a "good" figure that is below expectations can still weaken a currency. An economic calendar shows the release time, the forecast and the previous value.
A time worth knowing: NFP is usually released on the first Friday of the month at 8:30 New York time — about 19:30 Thai time while the US is on daylight saving time, and about 20:30 in winter. Dates sometimes shift, so check the calendar every time.
What happens to costs during news
- Spreads widen: liquidity providers pull their quotes before the release to reduce risk, so spreads can be several times wider than normal for seconds to minutes.
- Slippage: stop orders and stop losses fill at the next available price, not the price you set. When price jumps, the difference can be large.
- Gaps through levels: price can jump past your stop level without trading there at all.
- Rejected or delayed orders: execution may be slower than usual.
For the cost basics, see spread, swap and commission.
Three main approaches
- Straddle before the release: a buy stop above price and a sell stop below it a few minutes before the news. Downside: wide spreads, and a two-way spike can trigger both sides and lose on both.
- Let the dust settle, then follow: skip the first 5–15 minutes, wait for spreads to normalise, then trade in the direction price has chosen or wait for a pullback (breakout and retest). Slower, but far cheaper.
- Avoid the news: no new trades for a period before and after high-impact releases, and reduce or close open positions. Many swing and day traders choose this. It is risk management, not a missed opportunity.
The chart below shows the weak spot of approach 1 when price spikes both ways.
Gold at 0.10 lot ($1 move = $10). Stop $5 away, so the expected maximum loss is $50. Suppose during the release price falls through the stop and the order fills another $3 further away. Actual loss ($5 + $3) × $10 = $80, 60% more than planned. Spread cost: at a normal $0.30 spread the cost is $0.30 × $10 = $3; if it hypothetically widens to $2.00 at the release, the cost becomes $2.00 × $10 = $20. If you straddled the release and both sides were hit under these conditions, the damage could be 2 × $80 = $160 from a plan you thought risked $50. Lesson: during news, size the trade from the risk that could really happen, not from the stop distance on the chart.
Who it suits
- Time: you must be at the screen at the release time; for US data that is evening to late night in Thailand.
- Temperament: decides quickly, does not panic at violent spikes, and is willing to sit on the sidelines when things are unclear.
- Account size: use smaller lots than usual, because the real risk is larger than the stop distance.
- Knowledge: understand what each release measures and what the market expects (fundamental analysis). For gold, see gold price drivers.
Weaknesses and common mistakes
- Believing a stop guarantees the price: during news, a stop is an instruction to close at the next price, not at your price.
- Guessing the number: entering before the release on a guess that the figure will be good or bad is a bet on an outcome that can go either way.
- Misreading the reaction: the market may react to another part of the report (such as a revised previous figure) more than the headline, so price can move against "logic".
- Whipsaw: price runs hard one way, then reverses within minutes (false breakouts).
- Forgetting open positions: a swing trade accidentally held through a big release takes the full hit.
- Account terms: some accounts restrict trading around news or change margin during it. Read the conditions first.
Unless you have a method tested with news-time spreads and slippage included, avoiding high-impact releases is the most reasonable choice.
On a phone
News trading on a phone adds risk, because mobile networks can lag or drop at the critical moment. If you do it, use pending orders placed in advance, each with a stop. For most people, the more useful phone habit is checking the week's calendar and setting reminders before big releases so they can manage open positions.
Summary
- News moves price because the actual figure differs from what the market expected.
- During news, spreads widen, slippage grows, and a stop does not guarantee the fill price.
- The main approaches: straddle, wait and follow, or avoid.
- Size the trade from the risk that could really happen, not the chart stop distance.
- Check the economic calendar every week, even if you never trade the news.