การเทรดตามเทรนด์ (Trend Following)Trend Following
ทำไมระบบตามเทรนด์ชนะไม่บ่อยแต่ยังมีโอกาสเป็นบวกได้ กติกาที่ใช้กันทั่วไป และการแพ้ติดกันยาว ๆ ที่ต้องเตรียมใจไว้Why trend-following systems win rarely yet can still be positive, the rules commonly used, and the long losing streaks you must expect.

ในบทความนี้ · 7
In this article · 7
การเทรดตามเทรนด์ (Trend Following) ตั้งอยู่บนความคิดง่าย ๆ ว่า "ราคาที่กำลังวิ่งไปทางหนึ่ง มีโอกาสวิ่งต่ออีกช่วงหนึ่ง" นักเทรดตามเทรนด์ไม่พยายามทายจุดกลับตัว ไม่ซื้อที่ก้นหรือขายที่ยอด แต่รอให้ราคาแสดงทิศทางก่อนแล้วค่อยตาม จุดที่หลายคนไม่รู้คือ ระบบแบบนี้มักชนะไม่ถึงครึ่ง และต้องผ่านช่วงแพ้ติดกันยาว ๆ ซึ่งเป็นเหตุผลที่คนส่วนใหญ่เลิกก่อนจะเห็นผล
ตามเทรนด์ทำงานอย่างไร
ระบบตามเทรนด์ส่วนใหญ่มีสามส่วน
- ตัวบอกเทรนด์: อะไรสักอย่างที่บอกว่าตอนนี้ราคาเป็นขาขึ้นหรือขาลง เช่น ราคาอยู่เหนือหรือใต้เส้นค่าเฉลี่ย (Moving Averages) เส้นค่าเฉลี่ยเร็วตัดเส้นช้า หรือราคาเบรกจุดสูงสุดในรอบ N วัน
- จุดตัดขาดทุนเริ่มต้น: มักใช้ระยะตามความผันผวน เช่น 2–3 เท่าของ ATR เพื่อให้ SL ไม่แคบเกินการแกว่งปกติ
- การออกแบบตามหลัง (Trailing Stop): ไม่ตั้งเป้ากำไรตายตัว แต่เลื่อน SL ตามราคาไปเรื่อย ๆ (Trailing Stops) จนกว่าเทรนด์จะหมด
หัวใจคือ "ตัดขาดทุนให้เร็ว ปล่อยกำไรให้วิ่ง" ไม้ส่วนใหญ่จะโดน SL หรือได้กำไรเล็กน้อย แต่ไม้ส่วนน้อยที่เจอเทรนด์ใหญ่จะได้กำไรหลายเท่าของความเสี่ยง และชดเชยไม้แพ้ทั้งหมด
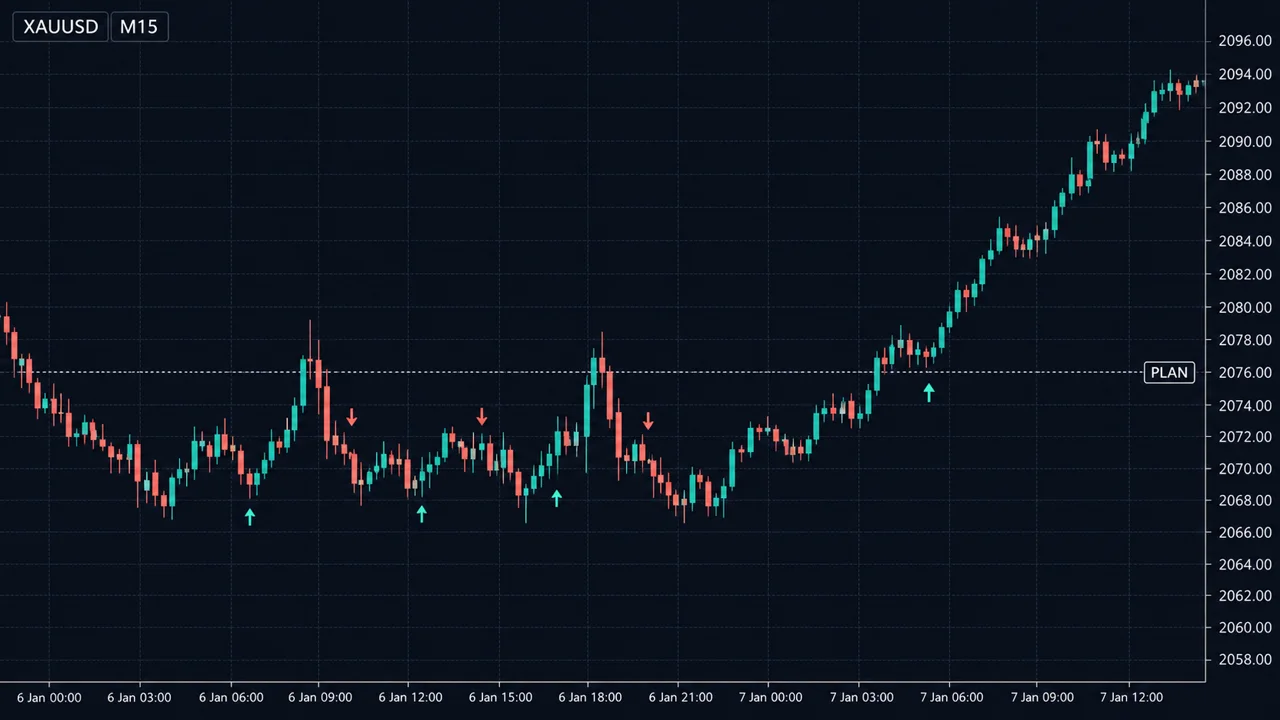
ดูภาพด้านล่าง
ตัวเลขเบื้องหลัง: ชนะน้อยแต่ยังเป็นบวกได้
สมมติว่าระบบชนะ 40% ไม้ชนะเฉลี่ยได้ 2.5R (R = เงินที่เสี่ยงต่อไม้) ไม้แพ้เสีย 1R ความคาดหวัง = 0.40 × 2.5 − 0.60 × 1 = 1.00 − 0.60 = 0.40R ต่อไม้ บัญชี $3,000 เทรด EURUSD ATR รายวัน 60 pip ใช้ SL = 2 × ATR = 120 pip ยอมเสีย 1% = $30 ล็อต = $30 ÷ (120 × $10) = 0.025 ปัดลงเป็น 0.02 ล็อต ความเสี่ยงจริง 120 × $0.20 = $24 = 1R ความคาดหวังเฉลี่ย 0.40 × $24 = $9.60 ต่อไม้ เป็นค่าเฉลี่ยระยะยาวเท่านั้น ไม่ใช่สิ่งที่จะได้ทุกไม้ แต่ความน่าจะเป็นที่จะแพ้ 8 ไม้ติดกันนับจากจุดใดจุดหนึ่ง = 0.6^8 ≈ 1.7% และ 8 ไม้แพ้ = 8 × $24 = $192 หรือราว 6.4% ของทุน
ตัวเลขชุดนี้เป็นสมมติฐานเพื่อแสดงโครงสร้าง ไม่ใช่ผลของระบบจริงใด ๆ อ่านต่อที่ ความคาดหวัง (Expectancy)
เหมาะกับใคร
- เวลา: ทำได้บนกราฟ H4/D1 จึงใช้เวลาน้อย ระบบตามเทรนด์บนกราฟเล็กก็มี แต่ต้นทุนและสัญญาณหลอกมากขึ้น
- นิสัย: รับการแพ้บ่อยได้ ไม่ปิดไม้กำไรเร็วเพราะกลัวกำไรหาย และทำตามกติกาแม้หลังแพ้หลายไม้ติด
- ขนาดบัญชี: ต้องใช้ความเสี่ยงต่อไม้ต่ำพอที่จะผ่านช่วงแพ้ติดยาวได้ มักอยู่ที่ 0.5–1%
- ต้นทุน: ไม่ใช่ประเด็นหลักบนกรอบเวลาใหญ่ แต่ค่าสวอปของไม้ที่ถือนานต้องนับด้วย
กติกาตัวอย่าง (เพื่อการศึกษา)
- ใช้กราฟ D1 ซื้อเมื่อราคาปิดเหนือจุดสูงสุดของ 20 แท่งล่าสุด ขายเมื่อปิดใต้จุดต่ำสุดของ 20 แท่ง
- SL เริ่มต้น = 2 × ATR(14) จากจุดเข้า
- เลื่อน SL ตามจุดต่ำสุดของ 10 แท่งล่าสุด (สำหรับไม้ซื้อ) ห้ามเลื่อนถอยหลัง
- ความเสี่ยงต่อไม้ 1% และเปิดได้ไม่เกิน 3 ไม้ในตลาดที่ไม่สัมพันธ์กัน
กติกานี้เป็นตัวอย่างโครงสร้างเท่านั้น ต้องทดสอบย้อนหลังและทดสอบไปข้างหน้าเองก่อนใช้ (การทดสอบย้อนหลัง)
จุดอ่อน / ข้อผิดพลาดที่พบบ่อย
- ตลาดออกข้าง: ช่วงที่ไม่มีเทรนด์ ระบบจะเข้า-โดน SL-เข้า-โดน SL ซ้ำ ๆ ซึ่งอาจกินเวลาหลายเดือน
- แพ้ติดยาว: ด้วยอัตราชนะต่ำ ช่วงแพ้ติด 6–10 ไม้เป็นเรื่องที่ต้องคาดไว้ ถ้าใช้ความเสี่ยงต่อไม้สูง จะเจ็บหนักก่อนเจอเทรนด์ที่ชดเชย (การแพ้ติดกัน)
- ปิดกำไรเร็วเกินไป: ถ้าตัดไม้ชนะที่ 1R เพราะกลัว สมการข้างบนจะพังทันที เพราะไม้ชนะไม่ใหญ่พอจะชดเชย
- คืนกำไรตอนเทรนด์จบ: Trailing Stop ต้องให้ราคาเดินกลับมาระยะหนึ่งก่อนจะปิด จึงคืนกำไรส่วนท้ายเสมอ
- ปรับพารามิเตอร์จนเกินพอดี: การหาค่าเส้นค่าเฉลี่ยที่ "ดีที่สุด" จากข้อมูลอดีตมักไม่ทำงานในอนาคต (Overfitting)
- เข้าไม้หลังข่าวกระชาก: สัญญาณเบรกที่เกิดจากข่าวแรงอาจกลับตัวทันที และ SL อาจลื่นไถล
ช่วงแพ้ติดเป็นส่วนหนึ่งของระบบตามเทรนด์ ถ้าเปลี่ยนกติกาทุกครั้งที่แพ้ 5 ไม้ คุณจะไม่มีวันอยู่ทันไม้ที่ชดเชยทั้งหมด ตัดสินจากข้อมูลไม้จำนวนมาก ไม่ใช่ความรู้สึก
ใช้บนมือถือ
ระบบตามเทรนด์บนกราฟ D1 เหมาะกับมือถือ เพราะตัดสินใจวันละครั้งหลังแท่งปิด ใช้คำสั่งรอแบบ Buy Stop/Sell Stop เหนือ-ใต้จุดเบรก แล้วอัปเดต SL วันละครั้ง ข้อควรระวังคือ Trailing Stop ในตัวแอปทำงานเฉพาะตอนแอปหรือเทอร์มินัลเปิดอยู่ จึงควรเลื่อน SL ด้วยมือในคำสั่งแทน
สรุป
- ตามเทรนด์คือรอให้ราคาแสดงทิศก่อน แล้วตาม ไม่ทายจุดกลับตัว
- ชนะไม่บ่อย แต่ไม้ชนะใหญ่กว่าไม้แพ้หลายเท่า ความคาดหวังจึงเป็นบวกได้ในทางทฤษฎี
- ใช้ SL ตามความผันผวนและ Trailing Stop แทนเป้าตายตัว
- เตรียมทุนและใจสำหรับการแพ้ติดยาวและช่วงตลาดออกข้าง
- ห้ามตัดไม้ชนะเร็ว เพราะทำให้สมการทั้งหมดใช้ไม่ได้
Trend following rests on a simple idea: price that is moving one way has a chance of continuing for a while. A trend follower does not try to predict reversals or buy the exact bottom; they wait for price to show its direction and then follow. What many people do not realise is that these systems often win less than half the time and go through long losing streaks — which is why most people quit before the method has a chance to work.
How trend following works
Most trend-following systems have three parts:
- A trend filter: something that says whether price is currently rising or falling — price above or below a moving average, a fast average crossing a slow one, or price breaking the highest high of the last N days.
- An initial stop: usually based on volatility, such as 2–3 times the ATR, so the stop is not inside normal noise.
- A trailing exit: no fixed target; the stop follows price (trailing stops) until the trend ends.
The core is "cut losses short, let profits run". Most trades hit the stop or make a little. A few trades catch a big trend, make many times the risk, and pay for all the losers.
See the chart below.
The numbers: winning rarely, still positive
Suppose a system wins 40% of the time, the average win is 2.5R (R = the amount risked per trade) and the average loss is 1R. expectancy = 0.40 × 2.5 − 0.60 × 1 = 1.00 − 0.60 = 0.40R per trade Account $3,000, EURUSD daily ATR 60 pips, stop = 2 × ATR = 120 pips. Risk 1% = $30. lot = $30 ÷ (120 × $10) = 0.025, rounded down to 0.02 lot; actual risk 120 × $0.20 = $24 = 1R. Average expectancy 0.40 × $24 = $9.60 per trade — a long-run average only, not what any single trade earns. But the probability of eight losses in a row from any given point is 0.6^8 ≈ 1.7%, and eight losses cost 8 × $24 = $192, about 6.4% of the account.
These figures are assumptions to show the structure, not results of any real system. More on this in expectancy.
Who it suits
- Time: works on H4/D1, so it takes little time. Trend systems exist on small timeframes too, but with more costs and more false signals.
- Temperament: accepts frequent losses, does not close winners early for fear of giving back profit, and follows the rules even after several losses in a row.
- Account size: risk per trade must be low enough to survive long losing streaks — usually 0.5–1%.
- Costs: not the main issue on large timeframes, but swap on long holds must be counted.
Example rules (for education)
- On D1, buy when price closes above the highest high of the last 20 candles; sell when it closes below the lowest low of the last 20.
- Initial stop = 2 × ATR(14) from entry.
- Trail the stop to the lowest low of the last 10 candles (for buys); never move it backwards.
- Risk 1% per trade, with at most three open positions in unrelated markets.
This is only an example of structure. Backtest and forward-test it yourself before using it (backtesting).
Weaknesses and common mistakes
- Sideways markets: without a trend the system enters, gets stopped, enters, gets stopped — for months, possibly.
- Long losing streaks: with a low win rate, runs of 6–10 losses are to be expected. With high risk per trade, the damage is severe before the trend that pays for it arrives (losing streaks).
- Closing winners too early: if you cut winners at 1R out of fear, the maths above collapses — winners are no longer big enough to pay for the losers.
- Giving back profit at the end: a trailing stop needs price to come back some distance before it closes you out, so you always return the last part of the move.
- Over-tuning parameters: finding the "best" moving average on past data rarely works going forward (overfitting).
- Entering after a news spike: a breakout signal caused by a big release can reverse immediately, and the stop can slip.
Losing streaks are part of trend following. If you change the rules every time you lose five in a row, you will never be there for the trade that pays for everything. Decide from data over many trades, not from feelings.
On a phone
A D1 trend system suits a phone well, because the decision happens once a day after the candle closes. Use buy stop / sell stop orders above and below the breakout level and update the stop once a day. Note that the platform's built-in trailing stop only works while that terminal is running, so on a phone it is safer to move the stop manually in the order itself.
Summary
- Trend following waits for price to show direction and then follows; it does not predict reversals.
- It wins rarely, but winners are several times larger than losers, so expectancy can be positive in principle.
- Use volatility-based stops and trailing exits instead of fixed targets.
- Prepare capital and nerves for long losing streaks and sideways periods.
- Never cut winners short — it breaks the whole equation.