รูปแบบแท่งเทียนที่ใช้บ่อย (Candlestick Patterns)Candlestick Patterns That Matter
รู้จัก Pin Bar, Engulfing, Inside Bar, Doji และ Morning/Evening Star ว่าบอกอะไร ใช้ตรงไหน และทำไมใช้เดี่ยว ๆ ไม่ได้What pin bars, engulfing bars, inside bars, dojis and morning/evening stars tell you, where they matter, and why they fail on their own.

ในบทความนี้ · 6
In this article · 6
รูปแบบแท่งเทียน (Candlestick Patterns) คือการอ่าน "การต่อสู้ระหว่างผู้ซื้อกับผู้ขาย" ภายในแท่งเดียวหรือไม่กี่แท่ง มีชื่อรูปแบบมากมายหลายสิบชื่อ แต่ในการใช้งานจริง รูปแบบไม่กี่แบบที่เข้าใจลึกก็เพียงพอ บทความนี้สมมติว่าคุณรู้จักส่วนประกอบของแท่งเทียน (ตัวเทียน ไส้ ราคาเปิด-ปิด) แล้ว ถ้ายังไม่แน่ใจ อ่าน พื้นฐานแท่งเทียน ก่อน
หลักคิดก่อนจำชื่อรูปแบบ
แท่งเทียนทุกแท่งตอบ 3 คำถาม
- ใครชนะตอนปิด ราคาปิดอยู่ใกล้จุดสูงสุด (ผู้ซื้อชนะ) หรือใกล้จุดต่ำสุด (ผู้ขายชนะ)
- มีการปฏิเสธราคาไหม ไส้ยาวแปลว่าราคาไปถึงตรงนั้นแล้วถูกผลักกลับ
- แท่งนี้ใหญ่หรือเล็กเมื่อเทียบกับแท่งรอบ ๆ แท่งใหญ่ผิดปกติแปลว่ามีแรงเข้ามามาก
ถ้าคุณตอบ 3 ข้อนี้ได้ คุณไม่จำเป็นต้องจำชื่อทุกรูปแบบ
รูปแบบหลักที่ควรรู้
Pin Bar (Hammer / Shooting Star)
แท่งที่มีไส้ยาวด้านหนึ่ง (มักยาว 2 เท่าของตัวเทียนขึ้นไป) และตัวเทียนเล็กอยู่อีกปลาย
- ไส้ยาวด้านล่าง (Hammer หรือ Bullish Pin) = ราคาลงไปแล้วถูกซื้อกลับ
- ไส้ยาวด้านบน (Shooting Star หรือ Bearish Pin) = ราคาขึ้นไปแล้วถูกขายกลับ
Engulfing (กลืนกิน)
แท่งที่สองมีตัวเทียนใหญ่ครอบตัวเทียนของแท่งแรกทั้งหมดในทิศตรงข้าม Bullish Engulfing คือแท่งเขียวใหญ่กลืนแท่งแดงก่อนหน้า บอกว่าผู้ซื้อเข้ามาแรงพอจะลบสิ่งที่ผู้ขายทำไว้
Inside Bar
แท่งที่สองมีจุดสูงต่ำอยู่ภายในแท่งแรกทั้งหมด บอกว่าตลาดกำลังหยุดคิด ใช้เป็นจุดพักก่อนเบรกไปทางใดทางหนึ่ง
Doji
ราคาเปิดและปิดเกือบเท่ากัน ตัวเทียนบางมาก บอกถึงความลังเล Doji เดี่ยว ๆ ในกลางกรอบแทบไม่มีความหมาย แต่ Doji หลังการวิ่งยาวที่แนวต้านอาจบอกว่าแรงซื้อเริ่มหมด
Morning Star / Evening Star
รูปแบบ 3 แท่ง Morning Star คือ แท่งแดงยาว ตามด้วยแท่งเล็ก แล้วตามด้วยแท่งเขียวที่ปิดเกินครึ่งของแท่งแรก บอกการเปลี่ยนจากแรงขายเป็นแรงซื้อ Evening Star คือกลับด้าน
| รูปแบบ | จำนวนแท่ง | บอกอะไร | ที่ที่มีความหมาย |
|---|---|---|---|
| Pin Bar | 1 | ปฏิเสธราคา | ที่แนวรับแนวต้าน/โซน |
| Engulfing | 2 | แรงเปลี่ยนฝั่ง | หลังการย่อ หรือที่โซน |
| Inside Bar | 2 | พักตัว | ในเทรนด์ ก่อนไปต่อ |
| Doji | 1 | ลังเล | หลังวิ่งยาวที่ระดับสำคัญ |
| Morning/Evening Star | 3 | กลับตัวช้า ๆ | ที่ปลายเทรนด์ |
ตำแหน่งสำคัญกว่ารูปแบบ
Pin Bar ที่สวยที่สุดกลางกรอบไม่มีความหมายเท่า Pin Bar ธรรมดาที่แนวรับ H4 ให้มองแท่งเทียนเป็น "สัญญาณยืนยัน" ของบริเวณที่คุณเลือกไว้แล้ว เช่น แนวรับแนวต้าน หรือโซนดีมานด์ ไม่ใช่เหตุผลหลักในการเข้าเทรด
Pin Bar ที่ยังไม่ปิดอาจกลายเป็นแท่งตัวยาวธรรมดาในนาทีสุดท้าย ตัดสินรูปแบบจากแท่งที่ปิดแล้วเท่านั้น
สมมติบน H1 ราคาลงมาถึงโซนแนวรับ แล้วแท่งปิดเป็น Pin Bar ดังนี้ เปิด 1,958 สูงสุด 1,962 ต่ำสุด 1,948 ปิด 1,960 ตัวเทียน = 1,960 − 1,958 = 2 ไส้บน = 1,962 − 1,960 = 2 ไส้ล่าง = 1,958 − 1,948 = 10 ความยาวทั้งแท่ง = 14 ไส้ล่างคิดเป็น 10 ÷ 14 ≈ 71% ของแท่ง เข้าเกณฑ์ Pin Bar ตั้ง Buy Stop เหนือจุดสูงที่ 1,962.50 SL ใต้จุดต่ำที่ 1,947.50 = ระยะ 15 ดอลลาร์ บัญชี $2,000 ใช้ 0.02 ล็อต → ความเสี่ยง 0.02 × 15 × 100 = $30 (1.5%) TP แบบ 2R = 30 ดอลลาร์ → 1,992.50 → กำไรถ้าถึงเป้า 0.02 × 30 × 100 = $60 ถ้าราคาไม่ขึ้นไปเหนือ 1,962.50 ออเดอร์ก็ไม่ถูกเติม ไม่มีความเสี่ยงเกิดขึ้น
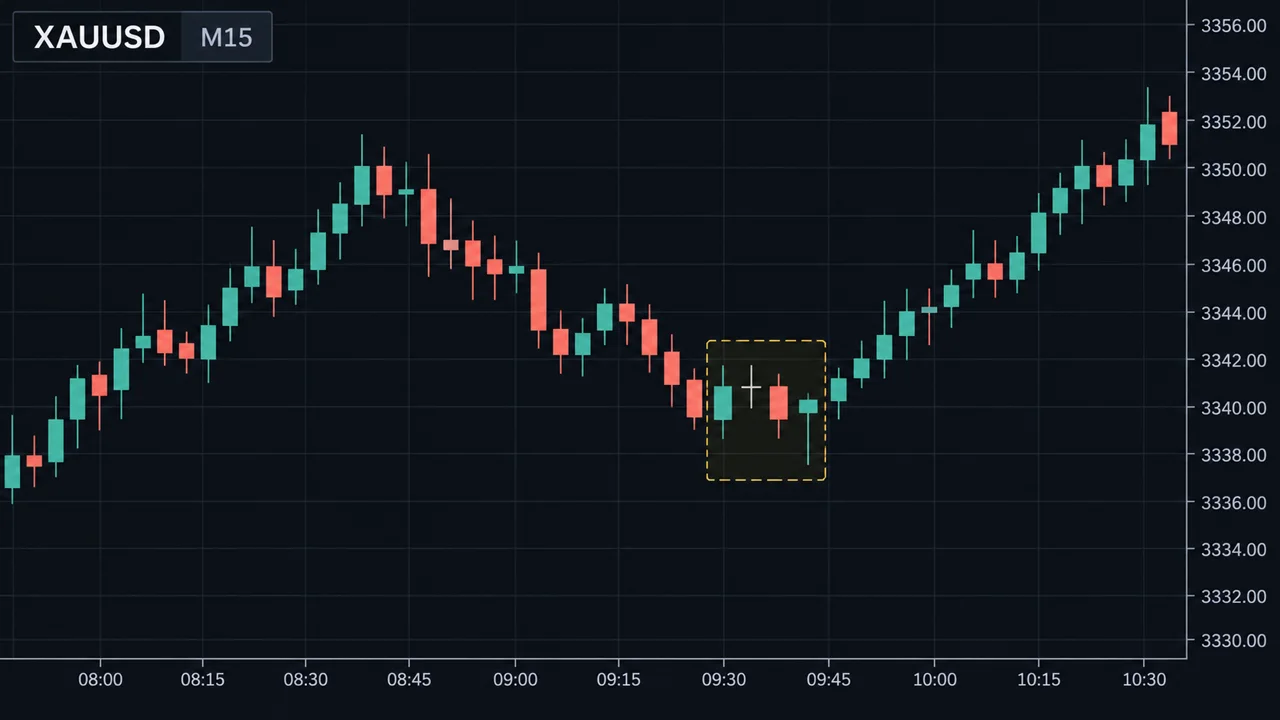
ดูภาพด้านล่าง ตัวอย่างนี้วาดเป็นกราฟ
จุดอ่อน / ข้อผิดพลาดที่พบบ่อย
- ใช้รูปแบบเดี่ยว ๆ รูปแบบแท่งเทียนเกิดบ่อยมาก ถ้าเข้าทุกครั้งที่เห็น จะเข้าเทรดในที่ไร้ความหมายจำนวนมาก
- ไม่เทียบขนาด Pin Bar ที่ยาวแค่ครึ่งหนึ่งของแท่งปกติ ไม่ได้บอกการปฏิเสธที่มีนัยสำคัญ
- ใช้บนไทม์เฟรมเล็กมาก M1–M5 มีรูปแบบเกิดตลอดเวลาจากการแกว่งปกติและสเปรด
- SL ไกลเกินไป แท่งสัญญาณที่ยาวมาก ทำให้ SL ไกล ถ้าไม่ลดล็อตตาม ความเสี่ยงจะเกินที่ตั้งใจ
- ไม่ดูเวลาปิดแท่งของโบรก แต่ละโบรกอาจใช้เวลาเซิร์ฟเวอร์ต่างกัน แท่ง D1 จึงหน้าตาต่างกันได้
- เชื่อชื่อรูปแบบมากกว่าบริบท ไม่มีรูปแบบไหนที่ "แม่นเสมอ" การที่รูปแบบมีชื่อไม่ได้แปลว่ามีความได้เปรียบ ต้องทดสอบกับข้อมูลของคุณเอง
ใช้บนมือถือ
บนมือถือ แท่งเทียนเล็กมากเมื่อซูมออก ให้ซูมเข้าเฉพาะช่วงที่ราคาอยู่ใกล้โซนที่วางไว้ และกดค้างที่แท่ง (Crosshair) เพื่ออ่านราคาเปิด สูง ต่ำ ปิดของแท่งนั้น การคำนวณขนาดไส้แบบในตัวอย่างทำได้ภายในไม่กี่วินาที
สรุป
- อ่านแท่งเทียนจาก 3 คำถาม ใครชนะตอนปิด มีการปฏิเสธไหม และแท่งใหญ่แค่ไหน
- รูปแบบหลักที่พอใช้งานได้จริง Pin Bar, Engulfing, Inside Bar, Doji, Morning/Evening Star
- ตำแหน่งที่เกิดสำคัญกว่าชื่อรูปแบบ ใช้เป็นสัญญาณยืนยันที่โซนเท่านั้น
- รอแท่งปิด และคำนวณล็อตจากระยะ SL ของแท่งสัญญาณ
- ไม่มีรูปแบบใดรับประกันผล ทดสอบก่อนใช้จริง
Candlestick patterns read the fight between buyers and sellers inside one candle or a few. There are dozens of named patterns, but in practice a handful understood deeply is enough. This article assumes you already know the parts of a candle (body, wick, open, close). If not, read candlestick basics first.
Think before you memorise names
Every candle answers three questions:
- Who won at the close? A close near the high means buyers won; near the low means sellers won.
- Was price rejected? A long wick means price went there and got pushed back.
- How big is it compared with its neighbours? An unusually large candle means unusual participation.
If you can answer these three, you don't need to memorise every pattern name.
The main patterns to know
Pin bar (hammer / shooting star)
A candle with a long wick on one side (often at least twice the body) and a small body at the other end.
- Long lower wick (hammer, bullish pin) = price dropped and was bought back.
- Long upper wick (shooting star, bearish pin) = price rose and was sold back.
Engulfing
The second candle's body completely covers the first candle's body in the opposite direction. A bullish engulfing is a large green candle swallowing the prior red one: buyers came in hard enough to erase what sellers had done.
Inside bar
The second candle's high and low sit entirely within the first candle. The market is pausing. It is often used as a coil before a break one way or the other.
Doji
Open and close almost equal, a very thin body. It shows indecision. A lone doji in the middle of a range means very little; a doji after a long run into resistance may hint that buying is drying up.
Morning star / evening star
A three-candle pattern. Morning star: a long red candle, then a small candle, then a green candle closing beyond the midpoint of the first. It shows a shift from selling to buying. The evening star is the mirror image.
| Pattern | Candles | Tells you | Where it matters |
|---|---|---|---|
| Pin bar | 1 | Rejection | At S/R or zones |
| Engulfing | 2 | Control switched | After a pullback or at a zone |
| Inside bar | 2 | Pause | Inside a trend, before continuation |
| Doji | 1 | Indecision | After a long run at a key level |
| Morning/evening star | 3 | Gradual reversal | At the end of a trend |
Location beats pattern
The prettiest pin bar in the middle of nowhere means less than an ordinary pin bar at H4 support. Treat candles as confirmation at an area you already chose, such as support and resistance or a demand zone, not as the main reason to trade.
A pin bar that hasn't closed can turn into an ordinary long candle in its final minute. Judge patterns only on closed candles.
Suppose on H1 price drops into a support zone and a candle closes as a pin bar: open 1,958, high 1,962, low 1,948, close 1,960. Body = 1,960 − 1,958 = 2. Upper wick = 1,962 − 1,960 = 2. Lower wick = 1,958 − 1,948 = 10. Total range = 14, so the lower wick is 10 ÷ 14 ≈ 71% of the candle. It qualifies as a pin bar. Place a buy stop above the high at 1,962.50 and a stop loss below the low at 1,947.50 = a $15 distance. On a $2,000 account using 0.02 lot → risk 0.02 × 15 × 100 = $30 (1.5%). A 2R target = $30 → 1,992.50 → profit at target 0.02 × 30 × 100 = $60. If price never trades above 1,962.50, the order never fills and there is no risk taken.
See the chart below: the same example drawn out.
Weaknesses and common mistakes
- Using patterns alone. Candle patterns appear constantly. Taking every one means trading in many meaningless places.
- Not comparing size. A pin bar half the size of a normal candle is not a meaningful rejection.
- Very low timeframes. On M1–M5, patterns form all the time from noise and spread.
- Stops too far. A very long signal candle means a distant stop. If you don't reduce the lot, you risk more than you planned.
- Ignoring broker close times. Brokers can use different server times, so D1 candles can look different from one platform to another.
- Trusting the name over the context. No pattern is "always right". Having a name does not give a pattern an edge; test it on your own data.
On a phone
Candles are tiny when zoomed out on a phone. Zoom in only when price is near your planned zone, and press and hold on a candle (crosshair) to read its open, high, low and close. Working out wick sizes like in the example takes seconds.
Summary
- Read candles with three questions: who won the close, was price rejected, and how big is it.
- The patterns worth knowing: pin bar, engulfing, inside bar, doji, morning/evening star.
- Location matters more than the name. Use patterns as confirmation at your zones.
- Wait for the close, and size the lot from the signal candle's stop distance.
- No pattern guarantees a result. Test before trading it live.