สร้างระบบเทรดของตัวเองทีละขั้นBuilding a Trading System Step by Step
ขั้นตอนจากไอเดียไปจนถึงระบบที่มีกฎครบ ทดสอบแล้ว และพร้อมใช้ด้วยขนาดไม้เล็ก พร้อมเช็คลิสต์ที่ใช้ได้จริงA practical path from an idea to a complete, tested rule set ready to trade at small size, with a checklist you can actually use.
ในบทความนี้ · 12
- ขั้นที่ 1: เริ่มจากเหตุผล ไม่ใช่อินดิเคเตอร์
- ขั้นที่ 2: เลือกตลาดและกรอบเวลา
- ขั้นที่ 3: เขียนกฎเข้าไม้ให้ตรวจได้
- ขั้นที่ 4: กฎออกไม้ทั้งขาดทุนและกำไร
- ขั้นที่ 5: ขนาดไม้และขีดจำกัด
- ขั้นที่ 6: ทดสอบย้อนหลัง
- ขั้นที่ 7: ประเมินและตัดสินใจ
- ขั้นที่ 8: Forward test แล้วค่อยเพิ่มขนาด
- เช็คลิสต์ระบบที่ครบ
- จุดอ่อน / ข้อผิดพลาดที่พบบ่อย
- ใช้บนมือถือ
- สรุป
In this article · 12
- Step 1: Start with a reason, not an indicator
- Step 2: Choose market and timeframe
- Step 3: Write entry rules you can check
- Step 4: Exit rules for both loss and profit
- Step 5: Position size and limits
- Step 6: Backtest
- Step 7: Evaluate and decide
- Step 8: Forward test, then scale
- A complete-system checklist
- Weaknesses / common mistakes
- On a phone
- Summary
ระบบเทรด (Trading system) คือชุดกฎที่บอกครบว่าเทรดอะไร เข้าเมื่อไหร่ ออกเมื่อไหร่ และเสี่ยงเท่าไหร่ จุดประสงค์ไม่ใช่การหาสูตรที่ไม่แพ้ ซึ่งไม่มีอยู่จริง แต่คือการทำให้การตัดสินใจทุกครั้งสม่ำเสมอ วัดผลได้ และปรับปรุงได้ บทความนี้พาไล่ทีละขั้นตั้งแต่ไอเดียจนพร้อมใช้งาน
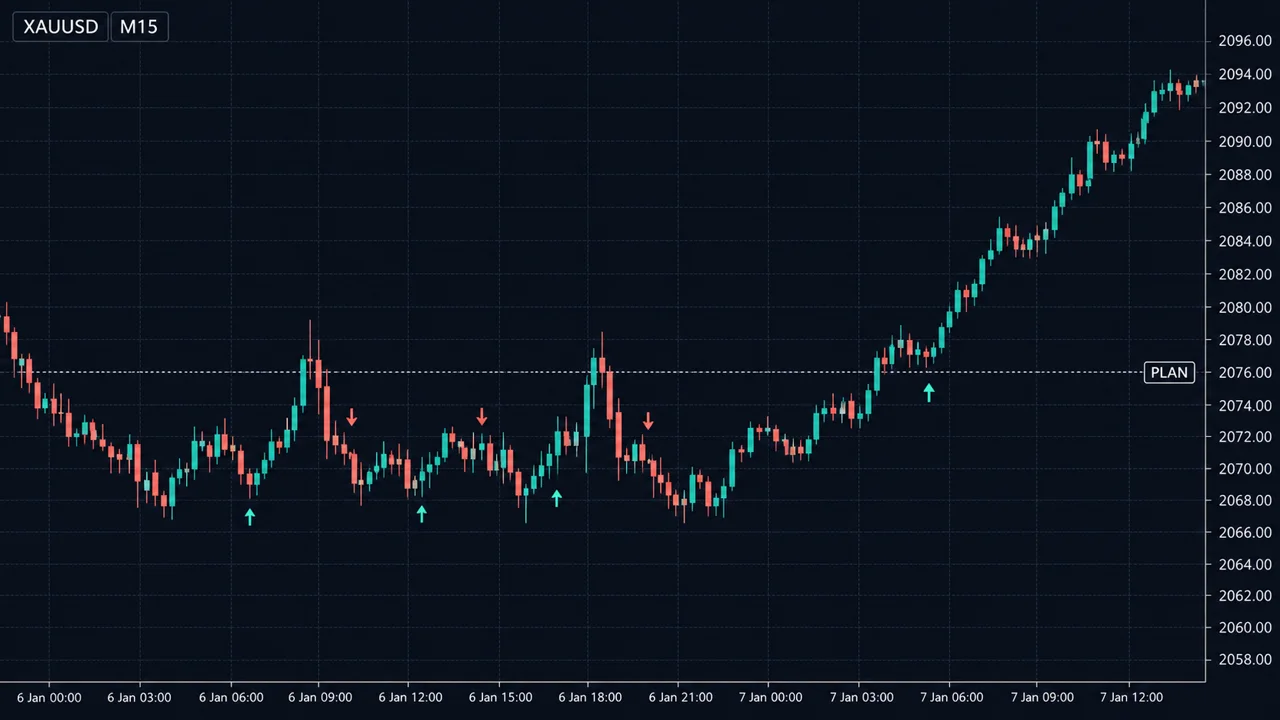
ดูภาพด้านล่าง
ขั้นที่ 1: เริ่มจากเหตุผล ไม่ใช่อินดิเคเตอร์
ถามก่อนว่า "ทำไมราคาควรเคลื่อนที่แบบที่เราคิด" ตัวอย่างแนวคิดที่มีเหตุผลรองรับ
- ตลาดที่มีแนวโน้มมักเดินต่อมากกว่ากลับตัวทันที จึงซื้อตอนย่อในขาขึ้น (Trend following)
- ราคาที่ยืดออกจากค่าเฉลี่ยมาก ๆ ในตลาดไซด์เวย์มักกลับเข้าหาค่าเฉลี่ย (Mean reversion)
- ช่วงเปิดตลาดใหญ่มักมีแรงซื้อขายเข้ามาทำให้ราคาหลุดกรอบ
เลือกแนวคิดเดียวที่เข้าใจและเข้ากับเวลาชีวิตของตัวเอง เช่น ทำงานประจำก็ไม่ควรเลือกระบบที่ต้องเฝ้าจอ M1
ขั้นที่ 2: เลือกตลาดและกรอบเวลา
ระบุให้ชัด เช่น EURUSD กราฟ H1 หรือทองคำ กราฟ H4 ดูว่าต้นทุน (สเปรด คอมมิชชัน) เทียบกับระยะที่คาดว่าจะได้แล้วไม่กินกำไรมากเกินไป กรอบเวลาเล็กมากต้นทุนต่อไม้จะเป็นสัดส่วนที่ใหญ่ขึ้น
ขั้นที่ 3: เขียนกฎเข้าไม้ให้ตรวจได้
กฎที่ดีตอบได้ว่า "ใช่" หรือ "ไม่ใช่" โดยไม่ต้องตีความ เช่น
- ราคาปิดเหนือ EMA 50 บนกราฟ H1 (กำหนดทิศทาง)
- ราคาย่อลงมาแตะ EMA 20
- แท่งถัดไปปิดสูงกว่าจุดสูงสุดของแท่งก่อนหน้า = เข้าซื้อตอนเปิดแท่งถัดไป
ขั้นที่ 4: กฎออกไม้ทั้งขาดทุนและกำไร
- Stop loss: วางตามโครงสร้าง เช่น ใต้จุดต่ำสุดล่าสุด หรือตามความผันผวน เช่น 1.5 เท่าของ ATR
- Take profit: เป็นเท่าของความเสี่ยง (เช่น 2R) หรือที่แนวต้านถัดไป หรือใช้ trailing stop
- ออกตามเวลา: เช่น ถ้าผ่านไป 24 แท่งยังไม่ถึงไหน ให้ปิด
ขั้นที่ 5: ขนาดไม้และขีดจำกัด
ใช้สูตร ล็อต = เงินที่ยอมเสีย ÷ (ระยะ SL × มูลค่าต่อจุด) และกำหนดขีดจำกัดรายวันหรือรายสัปดาห์ เช่น ขาดทุนครบ 3% ในวันเดียวให้หยุด ดู การคำนวณขนาดไม้
ยอมเสีย 1% ต่อไม้ = $20 SL ห่าง 25 pips (EURUSD 1 pip = $10 ต่อ 1 ล็อต) ล็อต = 20 ÷ (25 × 10) = 0.08 ล็อต TP ที่ 2R = 50 pips กำไรถ้าถึง TP = 50 × 10 × 0.08 = $40 อัตราชนะขั้นต่ำเพื่อเท่าทุน (ยังไม่รวมต้นทุน) = 1 ÷ (1 + 2) ≈ 33.3% รวมสเปรด 1 pip ต่อไม้ = 1 × 10 × 0.08 = $0.80: ไม้ชนะเหลือ $39.20 ไม้แพ้กลายเป็น $20.80 อัตราชนะเท่าทุนใหม่ = 20.80 ÷ (39.20 + 20.80) = 20.80 ÷ 60 ≈ 34.7% ต้นทุนเล็กนิดเดียว ยังขยับเส้นเท่าทุนขึ้นมาเกือบ 1.4 จุดเปอร์เซ็นต์
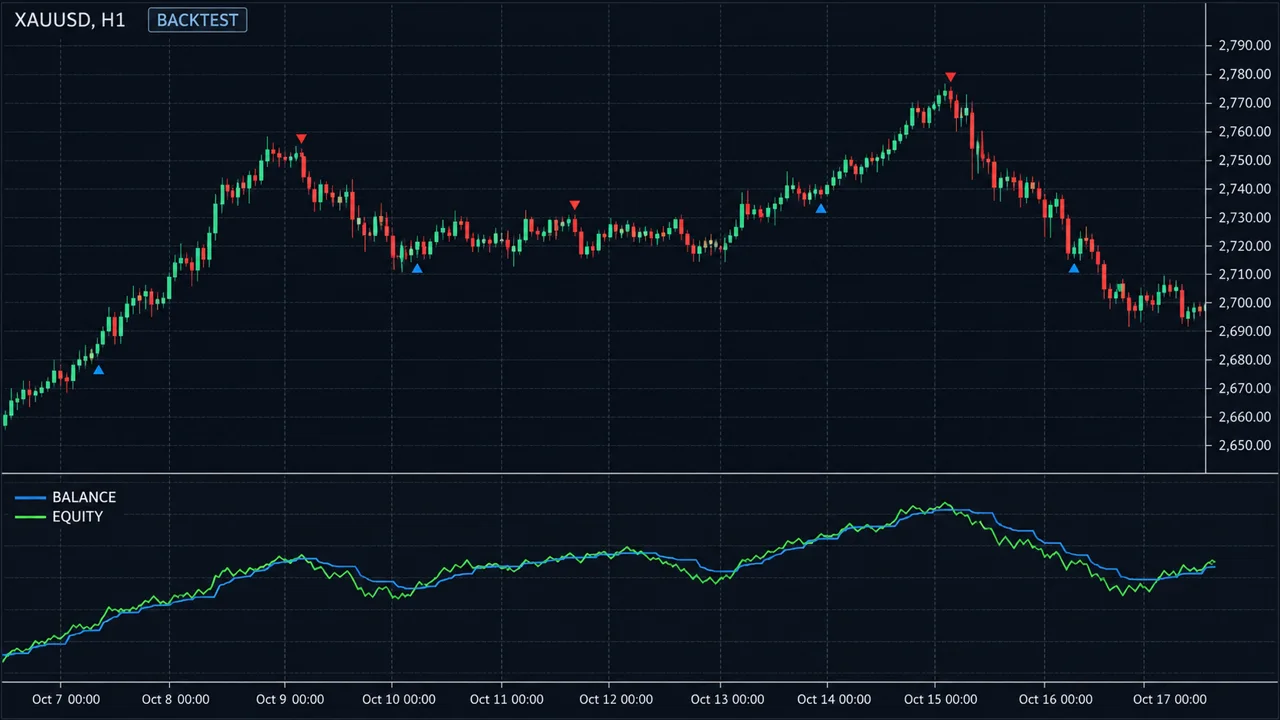
ดูภาพด้านล่าง
ขั้นที่ 6: ทดสอบย้อนหลัง
ทำ Backtest ด้วยมือหรือด้วย EA กันข้อมูลช่วงท้ายไว้ทดสอบแยก รวมต้นทุนจริง และเก็บให้ได้อย่างน้อยประมาณ 100 ไม้ ถ้าจะให้ AI ช่วยเขียน EA จากกฎที่เขียนไว้ ดูตัวอย่างคำสั่งที่ หน้ารวม prompt
ขั้นที่ 7: ประเมินและตัดสินใจ
ดู Expectancy, Profit Factor, Max drawdown และแพ้ติดกันยาวสุด ถ้า expectancy หลังต้นทุนไม่เป็นบวกอย่างชัดเจน ให้ทิ้งหรือกลับไปทบทวนแนวคิด อย่าเติมฟิลเตอร์ไปเรื่อย ๆ เพื่อช่วยให้รอด เพราะนั่นคือทางลัดสู่ Overfitting
ขั้นที่ 8: Forward test แล้วค่อยเพิ่มขนาด
ใช้กับตลาดจริงด้วยขนาดเล็กที่สุด เทียบผลกับกรอบปกติของ backtest ถ้าผ่านเกณฑ์ที่ตั้งไว้ จึงค่อยเพิ่มขนาดทีละขั้น และบันทึกทุกไม้ใน บันทึกการเทรด
เช็คลิสต์ระบบที่ครบ
| หมวด | ต้องตอบได้ |
|---|---|
| ตลาด / เวลา | เทรดอะไร กรอบไหน ช่วงเวลาไหน |
| เข้าไม้ | เงื่อนไขที่ตรวจได้ทุกข้อ |
| ออกไม้ | SL TP และการออกตามเวลา |
| ความเสี่ยง | % ต่อไม้ ขีดจำกัดรายวันและรายสัปดาห์ |
| ห้ามเทรด | ข่าว วันหยุด สเปรดกว้าง |
| ทบทวน | ทุกกี่ไม้ ใช้ตัวเลขอะไร และเกณฑ์หยุดระบบ |
จุดอ่อน / ข้อผิดพลาดที่พบบ่อย
- เริ่มจากอินดิเคเตอร์แทนเหตุผล แล้วซ้อนอินดิเคเตอร์จนกฎขัดกันเอง
- ไม่มีกฎออกไม้ที่ชัด ส่วนใหญ่คิดแต่จุดเข้า แต่กำไรขาดทุนตัดสินกันที่จุดออก
- เปลี่ยนระบบทุกครั้งที่แพ้ติดกัน ทั้งที่ยังอยู่ในกรอบปกติ
- ระบบไม่เข้ากับชีวิต กฎที่ต้องเฝ้าจอตอนตีสาม จะถูกละเมิดในไม่ช้า
- ขนาดไม้ไม่คงที่ ระบบดีแค่ไหน ถ้าบางไม้เสี่ยง 1% บางไม้เสี่ยง 10% ผลจะขึ้นกับไม้ใหญ่ไม่กี่ไม้
ใช้บนมือถือ
เก็บเช็คลิสต์ระบบไว้ในโน้ตของมือถือ และเปิดดูก่อนกดทุกครั้ง ใช้การแจ้งเตือนราคาแทนการเฝ้าจอ และคำนวณล็อตจากสูตรในเครื่องคิดเลขหรือสเปรดชีตก่อนส่งคำสั่ง
สรุป
- ระบบคือกฎครบชุด: ตลาด เข้า ออก ขนาด และขีดจำกัด
- เริ่มจากเหตุผลที่อธิบายได้ แล้วค่อยเลือกเครื่องมือ
- คิดต้นทุนตั้งแต่ต้น เพราะมันขยับเส้นเท่าทุนเสมอ
- Backtest แล้ว forward test ก่อนเพิ่มขนาด
- ระบบที่ดีคือระบบที่เราทำตามได้จริงทุกไม้
A trading system is a complete set of rules that says what you trade, when you enter, when you exit and how much you risk. The point is not to find a formula that never loses, because none exists. The point is to make every decision consistent, measurable and improvable. This article walks through each step from idea to something ready to trade.
See the chart below.
Step 1: Start with a reason, not an indicator
First ask, "why should price move the way I expect?" Examples of ideas with a reason behind them:
- Trending markets tend to continue more often than they reverse immediately, so buy pullbacks in uptrends (trend following).
- In a sideways market, price stretched far from its average tends to come back toward it (mean reversion).
- The opening of a major session often brings volume that pushes price out of its range.
Pick one idea you understand that fits your life. If you have a day job, a system that needs you watching M1 charts is the wrong choice.
Step 2: Choose market and timeframe
Be specific: EURUSD on H1, or gold on H4. Check that costs (spread, commission) are small relative to the move you expect to capture. On very low timeframes, costs eat a much larger share of each trade.
Step 3: Write entry rules you can check
A good rule answers yes or no with no interpretation. For example:
- Price closes above the 50 EMA on H1 (direction).
- Price pulls back to touch the 20 EMA.
- The next candle closes above the previous candle's high: buy at the open of the following candle.
Step 4: Exit rules for both loss and profit
- Stop loss: based on structure, e.g. below the latest swing low, or on volatility, e.g. 1.5 × ATR.
- Take profit: a multiple of risk (e.g. 2R), the next resistance, or a trailing stop.
- Time exit: e.g. if nothing has happened after 24 bars, close.
Step 5: Position size and limits
Use lot = money at risk ÷ (stop distance × value per point), and set daily or weekly limits, e.g. stop for the day after losing 3%. See Position sizing.
Risk 1% per trade = $20. Stop 25 pips away (EURUSD: 1 pip = $10 per 1.00 lot). Lot = 20 ÷ (25 × 10) = 0.08 lots. Target at 2R = 50 pips. Profit at target = 50 × 10 × 0.08 = $40. Break-even win rate before costs = 1 ÷ (1 + 2) ≈ 33.3%. Add a 1-pip spread per trade = 1 × 10 × 0.08 = $0.80: winners become $39.20, losers $20.80. New break-even win rate = 20.80 ÷ (39.20 + 20.80) = 20.80 ÷ 60 ≈ 34.7%. A tiny cost still moves the break-even line up by almost 1.4 percentage points.
See the charts below.
Step 6: Backtest
Run a backtest by hand or with an EA. Hold back the last part of the data for a separate test, include real costs, and collect roughly 100 trades or more. If you want an AI assistant to code your written rules as an EA, see the prompt library.
Step 7: Evaluate and decide
Look at expectancy, profit factor, maximum drawdown and the longest losing streak. If expectancy after costs is not clearly positive, drop the idea or rethink it. Do not keep adding filters to rescue it; that is the shortcut to overfitting.
Step 8: Forward test, then scale
Trade it live at the smallest size and compare results with the backtest's normal range. Only after it meets your criteria, increase size step by step, logging every trade in your trading journal.
A complete-system checklist
| Area | You must be able to answer |
|---|---|
| Market / time | What, which timeframe, which hours |
| Entry | Every condition, checkable |
| Exit | SL, TP and time exit |
| Risk | % per trade, daily and weekly limits |
| No-trade | News, holidays, wide spreads |
| Review | How often, which numbers, when to stop the system |
Weaknesses / common mistakes
- Starting from indicators instead of a reason, then stacking indicators until the rules contradict each other.
- No clear exit rules. Most people think only about entries, but profit and loss are decided at the exit.
- Changing systems after every losing streak, even when it is within the normal range.
- A system that does not fit your life. Rules that need you at the screen at 3 a.m. will soon be broken.
- Inconsistent size. However good the system, if some trades risk 1% and others 10%, results depend on a few large trades.
On a phone
Keep your system checklist in a notes app and read it before every order. Use price alerts instead of watching the screen, and work out the lot size with a calculator or spreadsheet before you send the order.
Summary
- A system is a complete rule set: market, entry, exit, size and limits.
- Start from a reason you can explain, then choose the tools.
- Account for costs from day one; they always move the break-even line.
- Backtest, then forward test, before increasing size.
- A good system is one you can actually follow on every trade.