การจำลอง Monte Carlo สำหรับระบบเทรดMonte Carlo Simulation for Trading Systems
สลับลำดับไม้และสุ่มผลซ้ำหลายพันรอบ เพื่อดูว่า drawdown และการแพ้ติดกันที่ "ปกติ" ของระบบอาจหนักกว่าที่เห็นใน backtest แค่ไหนReshuffle and resample your trades thousands of times to see how much worse normal drawdowns and losing streaks could be than the single backtest shows.
ในบทความนี้ · 6
In this article · 6
ผล backtest หนึ่งครั้งคือ "เส้นทางเดียว" ที่ระบบบังเอิญเดินผ่านในอดีต ถ้าไม้ชุดเดิมเกิดในลำดับต่างออกไป กำไรรวมอาจเท่าเดิม แต่ drawdown และการแพ้ติดกันอาจแย่กว่ามาก การจำลอง Monte Carlo (Monte Carlo simulation) คือการสร้างเส้นทางที่เป็นไปได้หลายพันเส้นจากข้อมูลไม้ที่มี เพื่อดูภาพกว้างของความเสี่ยง ไม่ใช่แค่เส้นเดียวที่เกิดขึ้น
แนวคิดพื้นฐาน
สมมติเรามีผลไม้ 200 ไม้จาก backtest แต่ละไม้เป็นตัวเลขเช่น +2R, −1R, +0.5R การจำลองทำได้หลายแบบ
- สลับลำดับ (Reshuffle) เอาไม้ทั้ง 200 ไม้มาเรียงใหม่แบบสุ่ม กำไรรวมเท่าเดิมทุกครั้ง แต่ drawdown เปลี่ยน เหมาะกับการดูว่าลำดับที่แย่จะเจ็บแค่ไหน
- สุ่มหยิบแบบใส่คืน (Resample / Bootstrap) สุ่มหยิบไม้จากชุดเดิม 200 ครั้ง โดยไม้เดิมถูกหยิบซ้ำได้ ทำให้ทั้งกำไรรวมและ drawdown เปลี่ยน เห็นทั้งกรณีดีและแย่
- ใส่ความแย่เพิ่ม เช่น สุ่มข้ามไม้ 10% (จำลองการพลาดสัญญาณ) หรือหักสลิปเพจเพิ่มทุกไม้ เพื่อดูว่าระบบยังรอดไหม
ทำซ้ำหลายพันรอบ แล้วดูการกระจายของผล เช่น drawdown ที่ 95% ของรอบไม่เกินค่าเท่าไหร่ (เปอร์เซ็นไทล์ที่ 95)
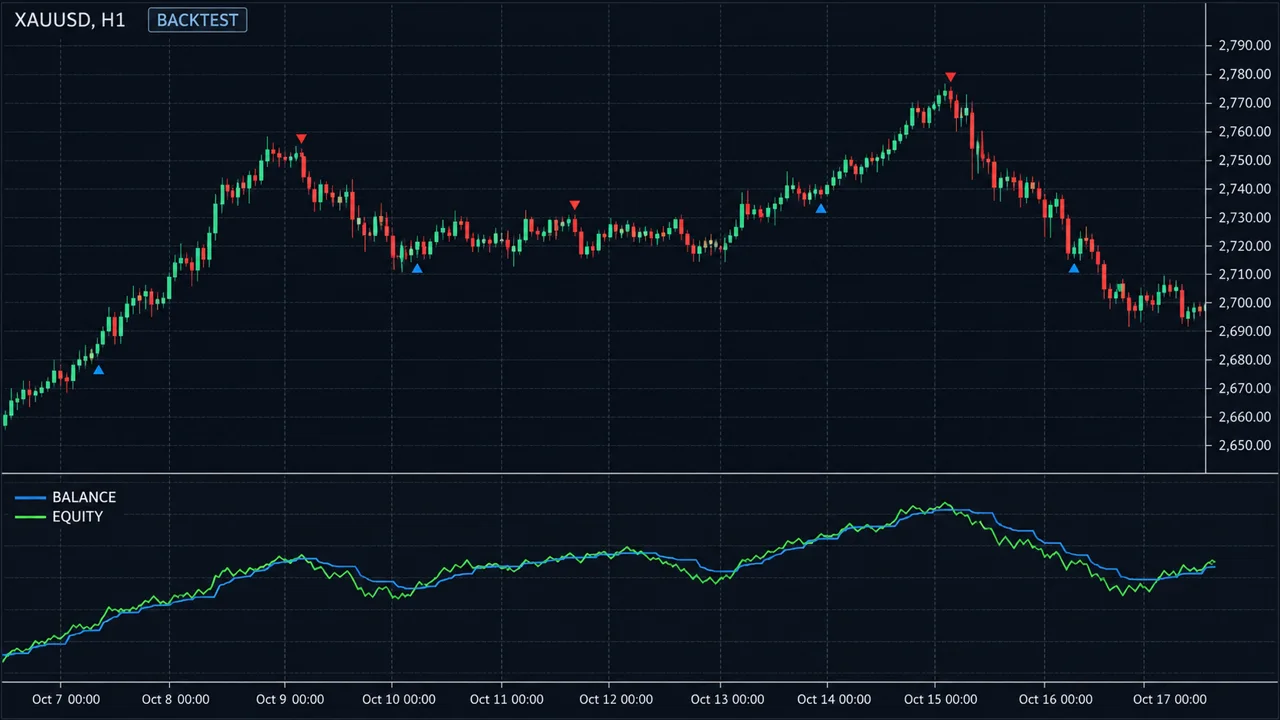
ดูภาพด้านล่าง
สมมติมี 10 ไม้: ชนะ 4 ไม้ไม้ละ +2R แพ้ 6 ไม้ไม้ละ −1R ผลรวม = 4 × 2 − 6 × 1 = +2R ไม่ว่าเรียงแบบไหน ลำดับ A ชนะ แพ้ ชนะ แพ้ ชนะ แพ้ ชนะ แพ้ แพ้ แพ้ ทุนสะสม: +2, +1, +3, +2, +4, +3, +5, +4, +3, +2 จุดสูงสุด +5 ลงไปต่ำสุด +2 = drawdown 3R ลำดับ B แพ้ 6 ไม้ติดก่อน แล้วชนะ 4 ไม้ ทุนสะสม: −1, −2, −3, −4, −5, −6, −4, −2, 0, +2 = drawdown 6R ถ้าบัญชี $5,000 เสี่ยง 1% ($50) ต่อ 1R: ลำดับ A เจ็บ $150 (3%) ลำดับ B เจ็บ $300 (6%) ผลสุดท้ายเท่ากัน แต่ความเจ็บต่างกันสองเท่า
โอกาสแพ้ติดกัน
คณิตศาสตร์ง่าย ๆ ช่วยตั้งความคาดหวังได้ สมมติระบบมีอัตราแพ้ 60% (ชนะ 40%) และแต่ละไม้ไม่เกี่ยวกัน โอกาสที่ไม้ 8 ไม้ที่กำหนดไว้แพ้ติดกันทั้งหมด = 0.6 ยกกำลัง 8 ≈ 0.0168 หรือประมาณ 1.7%
ฟังดูน้อย แต่นั่นคือโอกาสสำหรับ "ช่วง 8 ไม้ช่วงเดียว" ถ้าเทรดหลายร้อยไม้ จะมีช่วง 8 ไม้ให้เกิดได้หลายร้อยช่วง ทำให้โอกาสเจอแพ้ 8 ไม้ติดสักครั้งสูงขึ้นมาก นี่คือสิ่งที่ Monte Carlo แสดงให้เห็นเป็นตัวเลขได้ชัดกว่าการเดา
ถ้าเสี่ยง 2% ต่อไม้ แพ้ 8 ไม้ติด ทุนจะเหลือ 0.98 ยกกำลัง 8 ≈ 0.851 หรือลดลงประมาณ 14.9% ดูเรื่องนี้เพิ่มที่ การแพ้ติดกัน และ Risk of Ruin
ทำ Monte Carlo ด้วยสเปรดชีต
ไม่ต้องเขียนโปรแกรมก็ทำได้
- วางผลไม้ทั้งหมด (หน่วย R) ในคอลัมน์ A
- คอลัมน์ B ใส่สูตรสุ่ม เช่น
=RAND() - เรียงข้อมูลตามคอลัมน์ B จะได้ลำดับใหม่
- คอลัมน์ C คำนวณทุนสะสม คอลัมน์ D คำนวณระยะจากจุดสูงสุดก่อนหน้า หาค่าต่ำสุดคือ drawdown ของรอบนั้น
- ทำซ้ำหลายสิบรอบด้วยมือ หรือใช้ตารางข้อมูล (Data table) ให้คำนวณหลายร้อยรอบ
ถ้าเขียนโปรแกรมได้ ภาษาอย่าง Python ทำได้หลายหมื่นรอบในไม่กี่วินาที
ใช้ผลอย่างไร
- ตั้งความเสี่ยงต่อไม้ ถ้า drawdown ที่เปอร์เซ็นไทล์ 95 คือ 20R และเรายอมรับ drawdown ได้ไม่เกิน 10% ของพอร์ต ความเสี่ยงต่อไม้ไม่ควรเกิน 10% ÷ 20 = 0.5%
- ตั้งเกณฑ์หยุดระบบ ถ้า drawdown จริงเกินกรอบที่ Monte Carlo บอกว่าแทบไม่เกิด ให้หยุดทบทวน
- บัญชีกองทุน ดูว่าโอกาสชนขีดขาดทุนรายวันหรือขาดทุนรวมสูงแค่ไหน ลองตัวเลขกับ เครื่องคำนวณ Prop
จุดอ่อน / ข้อผิดพลาดที่พบบ่อย
- ขยะเข้า ขยะออก ถ้าข้อมูลไม้มาจาก backtest ที่ overfit หรือไม่รวมต้นทุน การสุ่มกี่หมื่นรอบก็ได้ผลที่หลอกตาเหมือนเดิม
- สมมติว่าแต่ละไม้ไม่เกี่ยวกัน ในความจริงไม้แพ้มักมาเป็นกลุ่มเมื่อตลาดเปลี่ยนสภาพ การสลับแบบสุ่มอาจทำให้ความเสี่ยงดูน้อยกว่าจริง
- ไม่มีเหตุการณ์ที่ไม่เคยเกิด Monte Carlo สร้างได้แค่จากไม้ที่มี ถ้าไม่เคยเจอกราฟกระโดดข้ามจุด (Gap) ใหญ่ในข้อมูล การจำลองก็จะไม่มี
- ดูแต่ค่ากลาง ประโยชน์จริงอยู่ที่กรณีแย่ (เปอร์เซ็นไทล์ 95 หรือ 99) ไม่ใช่ค่าเฉลี่ย
- ตัวอย่างตั้งต้นน้อย ไม้ 30 ไม้มาสุ่มหมื่นรอบ ไม่ได้ทำให้ข้อมูลมากขึ้นจริง
สรุป
- backtest หนึ่งครั้งคือเส้นทางเดียว Monte Carlo แสดงเส้นทางที่เป็นไปได้อีกหลายพันเส้น
- ไม้ชุดเดียวกันต่างลำดับ ให้ drawdown ต่างกันได้มาก
- ใช้ผลกรณีแย่ (เปอร์เซ็นไทล์ 95 ขึ้นไป) กำหนดความเสี่ยงต่อไม้และเกณฑ์หยุดระบบ
- ทำได้ด้วยสเปรดชีตธรรมดา
- ผลดีได้แค่เท่ากับคุณภาพข้อมูลไม้ที่ใส่เข้าไป
A single backtest is one path the system happened to take through history. Had the same trades arrived in a different order, the total profit could be identical while the drawdown and losing streaks were far worse. Monte Carlo simulation builds thousands of possible paths from the trades you have, so you see the range of risk rather than one lucky or unlucky line.
The basic idea
Say you have 200 trades from a backtest, each a number like +2R, −1R or +0.5R. There are several ways to simulate.
- Reshuffle. Put all 200 trades in a random order. Total profit is always the same, but drawdown changes. Good for seeing how much a bad sequence can hurt.
- Resample (bootstrap). Randomly draw 200 trades from the set, allowing the same trade to be drawn more than once. Both total profit and drawdown vary, showing good and bad cases.
- Add stress. Randomly skip 10% of trades (missed signals) or deduct extra slippage from every trade, and see whether the system still survives.
Repeat thousands of times and study the distribution, e.g. the drawdown that 95% of runs stay within (the 95th percentile).
See the chart below.
Take 10 trades: 4 winners of +2R and 6 losers of −1R. Total = 4 × 2 − 6 × 1 = +2R whatever the order. Order A: win, loss, win, loss, win, loss, win, loss, loss, loss. Running total: +2, +1, +3, +2, +4, +3, +5, +4, +3, +2. Peak +5, low after it +2 = drawdown 3R. Order B: six losses first, then four wins. Running total: −1, −2, −3, −4, −5, −6, −4, −2, 0, +2 = drawdown 6R. On a $5,000 account risking 1% ($50) per R: order A hurts $150 (3%), order B hurts $300 (6%). Same final result, twice the pain.
The odds of losing streaks
Simple maths sets expectations. Suppose a system loses 60% of the time (wins 40%) and trades are independent. The chance that a given run of 8 trades are all losers = 0.6 to the power 8 ≈ 0.0168, about 1.7%.
That sounds small, but it is the chance for one particular 8-trade window. Over several hundred trades there are hundreds of such windows, so the chance of meeting an 8-loss streak somewhere becomes much higher. Monte Carlo puts a number on that instead of a guess.
Risking 2% per trade, eight straight losses leave 0.98 to the power 8 ≈ 0.851 of the account, a fall of about 14.9%. See also Losing streaks and Risk of ruin.
Monte Carlo in a spreadsheet
No coding required.
- Paste all trade results (in R) into column A.
- In column B enter a random formula such as
=RAND(). - Sort by column B to get a new order.
- Column C holds the running total; column D the distance from the previous peak. Its minimum is that run's drawdown.
- Repeat a few dozen times by hand, or use a data table to calculate hundreds of runs.
If you code, a language like Python can run tens of thousands of simulations in seconds.
Using the results
- Set risk per trade. If the 95th-percentile drawdown is 20R and you can accept at most a 10% account drawdown, risk per trade should be no more than 10% ÷ 20 = 0.5%.
- Set a stop rule for the system. If the live drawdown exceeds what the simulation says almost never happens, stop and review.
- Funded accounts. Estimate how likely you are to hit a daily or overall loss limit. Try the numbers in the prop calculator.
Weaknesses / common mistakes
- Garbage in, garbage out. If the trades come from an overfitted backtest or exclude costs, ten thousand simulations will be just as misleading.
- Assuming trades are independent. In reality losses often cluster when the market changes regime. Random shuffling can make risk look smaller than it is.
- Nothing that never happened. The simulation only recombines trades you have. If your data never contained a large price gap, neither will the simulation.
- Looking only at the middle. The value lies in the bad cases (95th or 99th percentile), not the average.
- A small starting sample. Shuffling 30 trades ten thousand times does not create more information.
Summary
- One backtest is one path; Monte Carlo shows thousands of other possible paths.
- The same trades in a different order can produce very different drawdowns.
- Use the bad cases (95th percentile and beyond) to set risk per trade and stop rules.
- An ordinary spreadsheet is enough to start.
- Results are only as good as the trade data you feed in.