ตัวชี้วัดผลงานระบบเทรด (Profit Factor, Expectancy, Drawdown, Sharpe)Trading Performance Metrics (Profit Factor, Expectancy, Drawdown, Sharpe)
อ่านรายงานผลเทรดให้เป็น รู้ว่าแต่ละตัวเลขบอกอะไร คำนวณอย่างไร และตัวไหนหลอกตาได้ง่ายLearn to read a trading report: what each number tells you, how it is calculated, and which ones mislead easily.
In this article · 5
เวลาเปิดรายงานผล backtest หรือรายงานบัญชี เราจะเจอตัวเลขมากมาย แต่ไม่มีตัวเลขตัวไหนตัวเดียวที่บอกได้ว่าระบบดีหรือไม่ บทความนี้อธิบายตัวชี้วัดหลักที่เทรดเดอร์มืออาชีพใช้ วิธีคำนวณ และวิธีอ่านร่วมกันเพื่อไม่ให้ถูกตัวเลขสวย ๆ หลอก
ตัวชี้วัดหลักและสูตร
| ตัวชี้วัด | สูตร | บอกอะไร |
|---|---|---|
| อัตราชนะ (Win rate) | ไม้ชนะ ÷ ไม้ทั้งหมด | ชนะบ่อยแค่ไหน |
| Profit Factor (PF) | กำไรรวม ÷ ขาดทุนรวม | ได้กี่บาทต่อการเสียหนึ่งบาท |
| Expectancy | กำไรสุทธิ ÷ จำนวนไม้ | คาดว่าได้เฉลี่ยกี่บาทต่อไม้ |
| Max drawdown | ทุนลดจากยอดสูงสุดลงต่ำสุด | เจ็บที่สุดเท่าไหร่ |
| Recovery factor | กำไรสุทธิ ÷ Max drawdown | กำไรคุ้มกับความเจ็บไหม |
| Sharpe ratio | ผลตอบแทนเฉลี่ย ÷ ส่วนเบี่ยงเบนมาตรฐาน | ผลตอบแทนเทียบกับความผันผวน |
อัตราชนะ
ตัวเลขที่คนชอบดูที่สุด แต่บอกน้อยที่สุดถ้าดูตัวเดียว ระบบชนะ 80% ขาดทุนได้ถ้าไม้แพ้ใหญ่มาก และระบบชนะ 35% มีกำไรได้ถ้าไม้ชนะใหญ่กว่าไม้แพ้หลายเท่า ต้องดูคู่กับอัตราส่วนกำไรต่อขาดทุน ดู Risk:Reward กับ Win rate
Profit Factor
PF มากกว่า 1 แปลว่ามีกำไรก่อนต้นทุนที่ยังไม่ได้รวม PF เท่ากับ 1 คือเท่าทุน PF สูงมากจากไม้จำนวนน้อยมักเป็นเรื่องโชคหรือ overfit ควรดูว่า PF ยังเกิน 1 อยู่หรือไม่หลังรวมต้นทุนจริงทั้งหมด
Expectancy
Expectancy = (อัตราชนะ × กำไรเฉลี่ย) − (อัตราแพ้ × ขาดทุนเฉลี่ย) เป็นตัวเลขที่ตอบตรงที่สุดว่าระบบมีความได้เปรียบหรือไม่ นิยมแสดงเป็นหน่วย R (เท่าของความเสี่ยงต่อไม้) เพื่อเทียบระบบที่ใช้ขนาดไม้ต่างกันได้ รายละเอียดอยู่ที่ Expectancy
Max drawdown
วัดจากจุดสูงสุดของทุนลงไปจุดต่ำสุดก่อนจะทำจุดสูงสุดใหม่ ตัวเลขนี้สำคัญเพราะบอกว่าต้องทนเห็นเงินหายแค่ไหน และยังมีผลทางคณิตศาสตร์: ขาดทุน 20% ต้องกำไร 25% ถึงจะกลับมาเท่าเดิม ดู คณิตศาสตร์ของ Drawdown
Sharpe ratio
เทียบผลตอบแทนเฉลี่ยต่อช่วงเวลากับความผันผวนของผลตอบแทน (ส่วนเบี่ยงเบนมาตรฐาน) สูตรเต็มจะหักอัตราผลตอบแทนไร้ความเสี่ยงออกก่อน แต่เทรดเดอร์รายย่อยมักใช้แบบง่ายเพื่อเทียบระบบกันเอง ข้อจำกัดคือมันลงโทษทั้งความผันผวนขาขึ้นและขาลงเท่ากัน และใช้ข้อมูลเป็นช่วงเวลา (รายวันหรือรายเดือน) ไม่ใช่รายไม้
สมมติบัญชี $5,000 เทรด 50 ไม้ ชนะ 20 ไม้ เฉลี่ย +$60 แพ้ 30 ไม้ เฉลี่ย −$25
- อัตราชนะ = 20 ÷ 50 = 40%
- กำไรรวม = 20 × 60 = $1,200 ขาดทุนรวม = 30 × 25 = $750 กำไรสุทธิ = $450
- PF = 1,200 ÷ 750 = 1.6
- Expectancy = 450 ÷ 50 = $9 ต่อไม้ (ตรวจ: 0.4 × 60 − 0.6 × 25 = 24 − 15 = 9)
- ระหว่างทาง ทุนขึ้นไปสูงสุด $5,600 แล้วลงไปต่ำสุด $5,180 ก่อนฟื้น: Max drawdown = $420 = 420 ÷ 5,600 = 7.5%
- Recovery factor = 450 ÷ 420 ≈ 1.07
- ถ้าผลตอบแทนรายเดือนเฉลี่ย 2% และส่วนเบี่ยงเบนมาตรฐาน 4%: Sharpe รายเดือน = 2 ÷ 4 = 0.5 คิดเป็นรายปีโดยประมาณ = 0.5 × √12 ≈ 0.5 × 3.46 ≈ 1.73
ตัวเลขชุดนี้เป็นตัวอย่างสมมติเพื่อฝึกคำนวณเท่านั้น
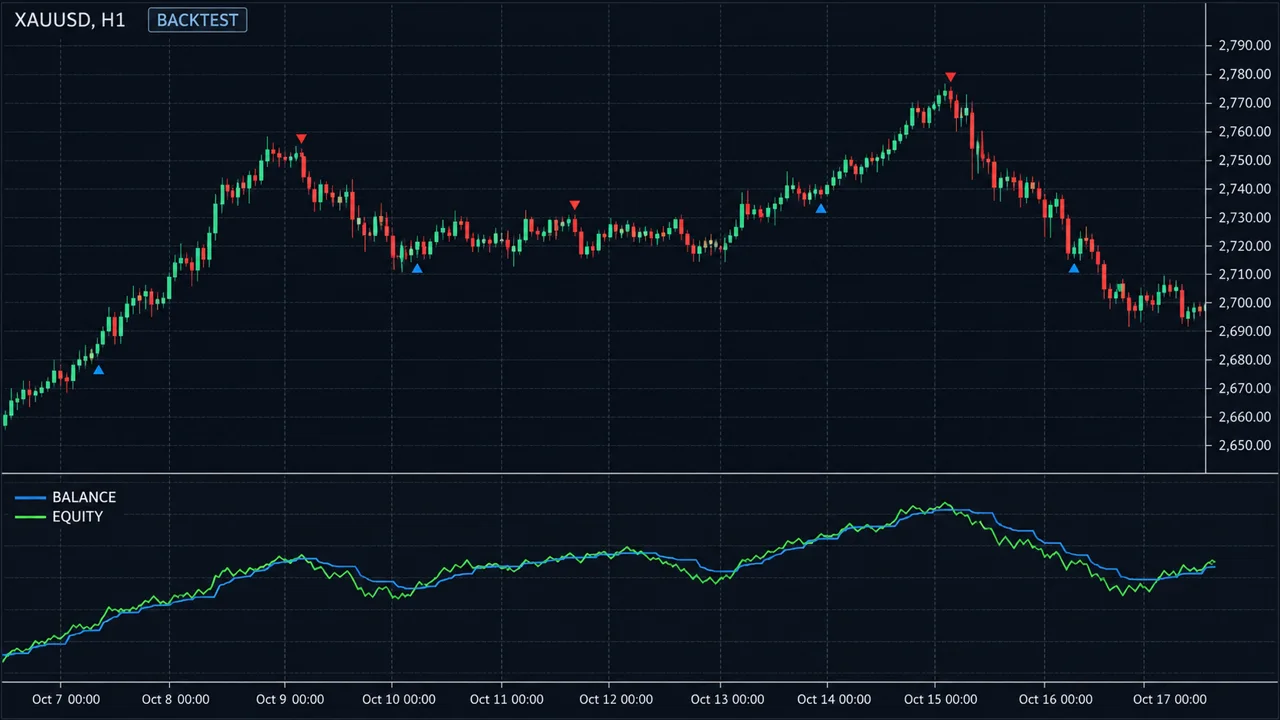
ดูภาพด้านล่าง
อ่านตัวเลขร่วมกัน
- Expectancy บวก + จำนวนไม้มาก เชื่อถือได้มากกว่า Expectancy สูงจากไม้ไม่กี่ไม้
- PF ดี แต่ drawdown ลึก อาจทนไม่ได้ในชีวิตจริง หรือผิดกฎบัญชีกองทุน ลองดูขีดจำกัดของบัญชีแบบนั้นด้วย เครื่องคำนวณ Prop
- อัตราชนะสูงมาก + ขาดทุนเฉลี่ยใหญ่กว่ากำไรเฉลี่ยหลายเท่า เป็นลายเซ็นของระบบที่ไม่ตัดขาดทุนหรือเฉลี่ยขาดทุน
- แพ้ติดกันยาวสุด ควรดูเสมอ เพราะบอกว่าต้องเตรียมใจและทุนแค่ไหน
- ระยะเวลาที่ drawdown ยาวนาน ทุนอยู่ใต้จุดสูงสุดนานกี่เดือน มีผลกับใจมากกว่าที่คิด
จุดอ่อน / ข้อผิดพลาดที่พบบ่อย
- ดูอัตราชนะตัวเดียว แล้วตัดสินระบบ
- เทียบ PF ของระบบที่จำนวนไม้ต่างกันมาก ระบบ 15 ไม้ PF 3 ไม่ได้ดีกว่าระบบ 500 ไม้ PF 1.3 เสมอไป
- ใช้ max drawdown จากยอดปิด (Balance) อย่างเดียว ถ้าระบบถือไม้ขาดทุนนาน drawdown ของ Equity ระหว่างทางจะลึกกว่ามาก
- ลืมว่าตัวเลขในอดีตเป็นค่าต่ำสุดของความเจ็บในอนาคต ไม่ใช่ค่าสูงสุด drawdown จริงอาจลึกกว่าที่เคยเห็น
- Sharpe สูงจากระบบที่ขายความเสี่ยงหางยาว เช่น ได้กำไรเล็ก ๆ สม่ำเสมอแต่มีโอกาสขาดทุนก้อนใหญ่ที่ยังไม่เกิดในข้อมูล
ใช้บนมือถือ
แอป MT5 บนมือถือแสดงประวัติและกำไรขาดทุนรวมได้ แต่ไม่คำนวณ PF หรือ drawdown ให้ วิธีง่ายคือส่งออกหรือจดผลแต่ละไม้ลงสเปรดชีตบนมือถือ แล้วตั้งสูตร PF, Expectancy และ drawdown ไว้ครั้งเดียว ใช้ได้ตลอด
สรุป
- ไม่มีตัวชี้วัดตัวเดียวที่บอกว่าระบบดี ต้องอ่านร่วมกัน
- Expectancy บอกความได้เปรียบ PF บอกประสิทธิภาพ drawdown บอกความเจ็บ
- ยิ่งจำนวนไม้มาก ตัวเลขยิ่งน่าเชื่อถือ
- ใช้ drawdown ของ Equity และเผื่อว่าอนาคตอาจลึกกว่าอดีต
- ระวังอัตราชนะสูงที่มาพร้อมไม้แพ้ใหญ่มาก
Open a backtest or account report and you will find dozens of numbers, but no single number tells you whether a system is good. This article covers the core metrics professionals use, how to calculate them, and how to read them together so attractive figures do not fool you.
Core metrics and formulas
| Metric | Formula | Tells you |
|---|---|---|
| Win rate | Winners ÷ total trades | How often you win |
| Profit Factor (PF) | Gross profit ÷ gross loss | Dollars made per dollar lost |
| Expectancy | Net profit ÷ number of trades | Average result per trade |
| Max drawdown | Fall from equity peak to trough | The worst pain so far |
| Recovery factor | Net profit ÷ max drawdown | Whether the profit justified the pain |
| Sharpe ratio | Average return ÷ standard deviation | Return relative to volatility |
Win rate
The number people love most, and the least informative on its own. An 80% win rate can lose money if the losers are huge, and a 35% win rate can be profitable if winners are several times larger than losers. Always read it next to the reward-to-risk ratio; see Risk:reward and win rate.
Profit Factor
A PF above 1 means profit before any costs not yet included. A PF of 1 is break-even. A very high PF from a handful of trades is usually luck or overfitting. Check that PF is still above 1 after all real costs.
Expectancy
Expectancy = (win rate × average win) − (loss rate × average loss). This is the most direct answer to whether a system has an edge. It is often expressed in R (multiples of the risk per trade) so systems with different sizing can be compared. More in Expectancy.
Max drawdown
Measured from an equity peak to the lowest point before a new peak. It matters because it tells you how much loss you must sit through, and because of the maths: a 20% loss needs a 25% gain to get back to even. See Drawdown recovery math.
Sharpe ratio
Compares the average return per period with the volatility of those returns (standard deviation). The full formula subtracts a risk-free rate first, but retail traders often use the simple version to compare systems with each other. Its limits: it penalises upside and downside volatility equally, and it uses periodic returns (daily or monthly), not individual trades.
Suppose a $5,000 account takes 50 trades: 20 winners averaging +$60 and 30 losers averaging −$25.
- Win rate = 20 ÷ 50 = 40%
- Gross profit = 20 × 60 = $1,200. Gross loss = 30 × 25 = $750. Net = $450
- PF = 1,200 ÷ 750 = 1.6
- Expectancy = 450 ÷ 50 = $9 per trade (check: 0.4 × 60 − 0.6 × 25 = 24 − 15 = 9)
- Along the way equity peaked at $5,600 and fell to $5,180 before recovering: max drawdown = $420 = 420 ÷ 5,600 = 7.5%
- Recovery factor = 450 ÷ 420 ≈ 1.07
- If monthly returns average 2% with a standard deviation of 4%: monthly Sharpe = 2 ÷ 4 = 0.5, roughly annualised = 0.5 × √12 ≈ 0.5 × 3.46 ≈ 1.73
These figures are hypothetical, for practising the calculations only.
See the charts below.
Reading the numbers together
- Positive expectancy over many trades is more credible than high expectancy over a few.
- Good PF but deep drawdown may be unbearable in practice, or break funded-account rules. Check those limits with the prop calculator.
- Very high win rate with an average loss several times the average win is the signature of a system that does not cut losses or averages down.
- Longest losing streak should always be checked; it tells you how much patience and capital you need.
- Drawdown duration — how many months equity sits below its peak — affects you more than you expect.
Weaknesses / common mistakes
- Judging a system by win rate alone.
- Comparing PF across very different sample sizes. A 15-trade system with PF 3 is not automatically better than a 500-trade system with PF 1.3.
- Using balance drawdown only. If the system holds losers for a long time, equity drawdown along the way can be much deeper.
- Forgetting that past drawdown is a floor for future pain, not a ceiling. The real drawdown may be deeper than anything seen so far.
- High Sharpe from systems that sell tail risk: small steady gains with a chance of a large loss that simply has not appeared in the data yet.
On a phone
The MT5 mobile app shows history and total profit, but does not calculate PF or drawdown. The easy fix is to log or export each trade into a spreadsheet on your phone and set up formulas for PF, expectancy and drawdown once. They keep working from then on.
Summary
- No single metric tells you a system is good; read them together.
- Expectancy shows the edge, PF the efficiency, drawdown the pain.
- More trades make every number more trustworthy.
- Use equity drawdown, and assume the future can be worse than the past.
- Be wary of high win rates paired with very large losers.
