Overfitting: ระบบที่เก่งแค่ในอดีตOverfitting: Systems That Only Work in the Past
เข้าใจว่าทำไมการปรับค่าจนกราฟทุนสวยมักพังในตลาดจริง และวิธีทดสอบว่าระบบมีความทนทานจริงหรือแค่จำอดีตได้Why tuning a system until the equity curve looks perfect usually fails live, and how to test whether a system is robust or has just memorised the past.
ในบทความนี้ · 6
In this article · 6
Overfitting (การปรับจนพอดีเกินไป หรือ Curve fitting) คือการที่ระบบเทรดถูกปรับแต่งจนเข้ากับข้อมูลในอดีต "พอดีเกินไป" จนมันจำความบังเอิญของข้อมูลชุดนั้นแทนที่จะจับรูปแบบที่เกิดซ้ำได้จริง ผลคือ backtest สวยมาก แต่พอใช้กับตลาดจริงกลับแย่ลงทันที นี่เป็นสาเหตุอันดับต้น ๆ ที่ระบบซึ่งดูดีบนกระดาษล้มเหลว
Overfitting เกิดขึ้นได้อย่างไร
ข้อมูลราคามีสองส่วนปนกัน คือ สัญญาณ (รูปแบบที่อาจเกิดซ้ำ) และ สัญญาณรบกวน (Noise: ความบังเอิญที่ไม่เกิดซ้ำ) ระบบที่ดีควรจับส่วนแรก แต่ทุกครั้งที่เราเพิ่มเงื่อนไขหรือปรับค่าเพื่อให้ผลอดีตดีขึ้น เราเสี่ยงที่จะไปจับส่วนหลัง
ลองนึกภาพนักเรียนที่ท่องคำตอบข้อสอบเก่าได้ทุกข้อ แต่ไม่เข้าใจวิธีคิด เขาจะได้เต็มในข้อสอบเก่า และสอบตกเมื่อโจทย์เปลี่ยนเล็กน้อย ระบบที่ overfit ก็เป็นแบบนั้น
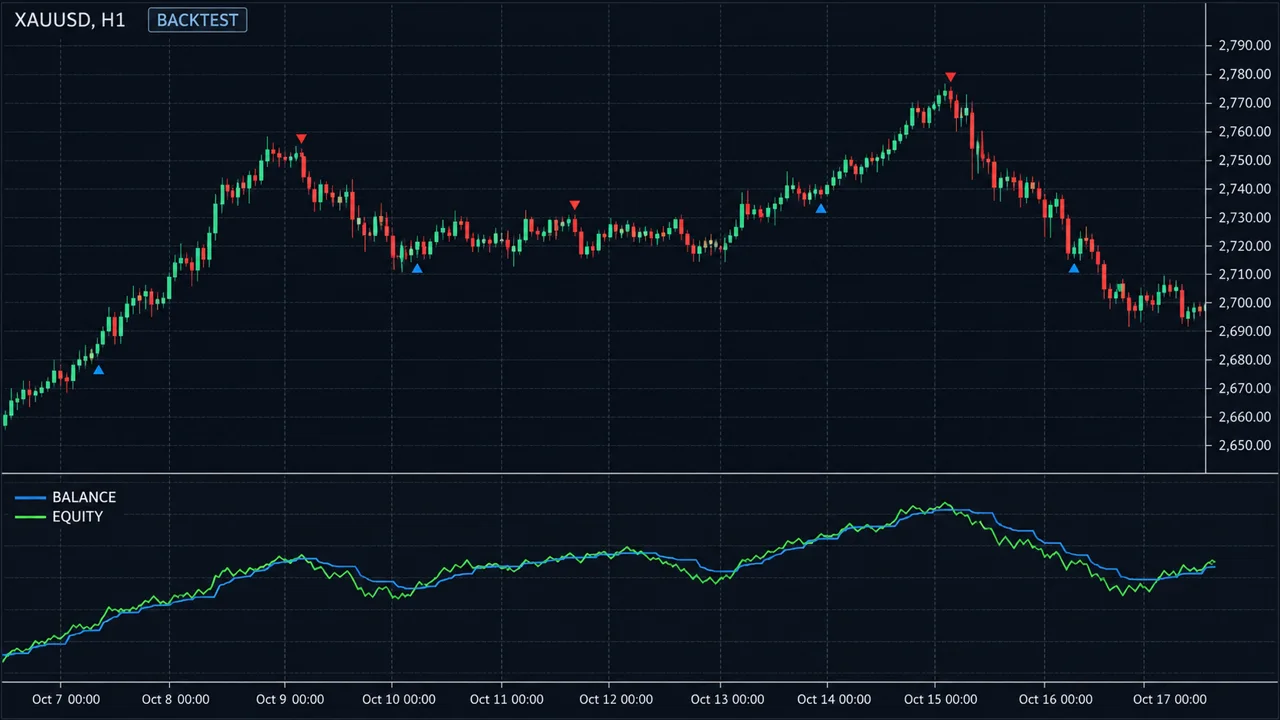
ดูภาพด้านล่าง
สัญญาณเตือนว่าระบบอาจ overfit
- พารามิเตอร์เยอะ มีค่าที่ต้องตั้งหลายสิบตัว เช่น ค่าอินดิเคเตอร์หลายตัว ฟิลเตอร์เวลา ฟิลเตอร์วันในสัปดาห์
- ค่าแปลก ๆ เช่น ค่าเฉลี่ย 37 แท่ง RSI 13 ระดับ 71.5 ซึ่งได้มาจากการลองทุกค่าแล้วเลือกตัวที่ดีที่สุด
- กราฟทุนเรียบเกินจริง ขึ้นแทบเป็นเส้นตรงหลายปี drawdown น้อยผิดธรรมชาติ
- ค่าใกล้เคียงให้ผลต่างกันมาก RSI 14 กำไรดี แต่ RSI 13 กับ 15 ขาดทุน แปลว่าเจอ "ยอดแหลม" ของความบังเอิญ
- จำนวนไม้น้อยเมื่อเทียบกับจำนวนเงื่อนไข กฎ 10 ข้อ แต่มีแค่ 40 ไม้
สมมติแต่ละไอเดียที่ไม่มีความได้เปรียบจริง มีโอกาส 5% ที่จะ "ดูดี" ในการทดสอบเพราะโชค ถ้าลอง 20 ไอเดีย จำนวนที่คาดว่าจะดูดีเพราะโชค = 20 × 0.05 = 1 ไอเดีย ถ้าลอง 200 ไอเดีย = 200 × 0.05 = 10 ไอเดีย ส่วนการปรับค่า: 5 พารามิเตอร์ ลองค่าละ 10 ค่า = 10 × 10 × 10 × 10 × 10 = 100,000 ชุด การเลือกชุดที่ดีที่สุดจากแสนชุด แทบแน่นอนว่าได้ชุดที่โชคดีกับข้อมูลนั้นที่สุด ไม่ใช่ชุดที่ดีที่สุดในอนาคต
วิธีป้องกันและตรวจสอบ
1. แบ่งข้อมูล In-sample / Out-of-sample
แบ่งข้อมูลเป็นสองส่วนก่อนเริ่ม เช่น ข้อมูล 10 ปี ใช้ 7 ปีแรก (In-sample) สำหรับสร้างและปรับระบบ แล้วเก็บ 3 ปีหลัง (Out-of-sample) ไว้ทดสอบครั้งเดียวตอนจบ ถ้าดูผลช่วงหลังแล้วกลับไปแก้ระบบ ช่วงนั้นก็ไม่ใช่ out-of-sample อีกต่อไป ใน Strategy Tester ของ MT5 มีช่อง Forward ที่ทำหน้าที่นี้ได้
2. Walk-forward
ทำซ้ำหลายรอบ: ปรับค่าในหน้าต่างข้อมูลหนึ่ง แล้วทดสอบกับช่วงถัดไปที่ยังไม่เห็น จากนั้นเลื่อนหน้าต่างไปเรื่อย ๆ ผลที่ได้จากช่วงที่ "ไม่เห็น" ทั้งหมดเมื่อต่อกันจะใกล้กับการใช้งานจริงมากกว่า
3. หาที่ราบ ไม่ใช่ยอดแหลม
เวลาปรับค่า ให้ดูตารางผลของค่าข้างเคียง ระบบที่ทนทานจะให้ผลใกล้เคียงกันในช่วงค่ากว้าง ๆ (ที่ราบ) เลือกค่ากลางที่ราบ ไม่ใช่จุดที่สูงที่สุดซึ่งรอบข้างตกฮวบ
4. ทดสอบในตลาดและช่วงเวลาอื่น
ถ้าแนวคิดมีเหตุผลรองรับจริง มักจะยังทำงานได้พอใช้ในตลาดที่คล้ายกันหรือในกรอบเวลาใกล้เคียง โดยไม่ต้องปรับค่าใหม่ ถ้าใช้ได้แค่ทองคำ H1 ช่วงปีเดียว ให้สงสัยไว้ก่อน
5. ลดจำนวนเงื่อนไข
กฎน้อยข้อที่มีเหตุผลอธิบายได้ ดีกว่ากฎยี่สิบข้อที่ทำให้กราฟสวย ทุกเงื่อนไขที่เพิ่มควรตอบได้ว่า "ทำไมมันควรได้ผล" ไม่ใช่แค่ "เพราะ backtest ดีขึ้น"
6. เผื่อความแย่ลง
แม้ระบบจะไม่ overfit ผลจริงก็มักแย่กว่า backtest เพราะต้นทุนและการส่งคำสั่ง ให้ตั้งความคาดหวังต่ำกว่าผลทดสอบเสมอ แล้วยืนยันด้วย Forward test
จุดอ่อน / ข้อผิดพลาดที่พบบ่อย
- คิดว่า out-of-sample ผ่านหนึ่งครั้งแปลว่าปลอดภัย ถ้าทดสอบหลายระบบกับช่วงเดียวกันแล้วเลือกตัวที่ผ่าน ก็ overfit กับช่วงนั้นได้อีกชั้น
- ปรับค่าใหม่ทุกครั้งที่ขาดทุน เป็นการไล่ตามสัญญาณรบกวนในตลาดจริง
- ใช้ Optimization ทุกพารามิเตอร์พร้อมกัน ยิ่งเพิ่มโอกาสเจอชุดบังเอิญ
- เกลียดระบบที่เรียบง่าย ระบบเรียบง่ายมักดูน่าเบื่อ แต่ทนทานกว่า
- ไม่นับว่าลองไปกี่ครั้ง ควรจดว่าทดสอบกี่ไอเดียกี่ชุดค่า เพื่อประเมินโอกาสเจอของปลอม
- แก้ overfit ด้วย overfit เช่น เพิ่มฟิลเตอร์ "ไม่เทรดวันพุธ" เพราะวันพุธในอดีตขาดทุน
ใช้บนมือถือ
การปรับค่าระบบทำบนมือถือไม่ได้จริงจัง แต่สิ่งที่ทำได้คือจดผลเทรดจริงต่อเนื่อง แล้วเทียบกับ backtest เป็นระยะ ถ้าเห็นว่าผลจริงห่างจาก backtest มากอย่างต่อเนื่อง นั่นอาจเป็นอาการของ overfit ที่ควรกลับไปตรวจบนคอมพิวเตอร์
สรุป
- Overfitting คือระบบที่จำความบังเอิญในอดีตแทนรูปแบบที่เกิดซ้ำ
- ยิ่งลองหลายไอเดียหรือหลายชุดค่า โอกาสเจอผลดีเพราะโชคยิ่งสูง
- กันข้อมูลไว้ทดสอบแยก ใช้ walk-forward และเลือกค่าบนที่ราบ
- กฎน้อยที่มีเหตุผล ดีกว่ากฎเยอะที่ทำให้กราฟสวย
- ยืนยันทุกระบบด้วยการทดสอบกับข้อมูลที่ยังไม่เคยเห็น
Overfitting, also called curve fitting, happens when a trading system is tuned so closely to past data that it memorises that data's accidents instead of capturing patterns that repeat. The backtest looks superb, and live results deteriorate almost immediately. It is one of the most common reasons systems that look great on paper fail.
How overfitting happens
Price data mixes two things: signal (patterns that may repeat) and noise (random accidents that will not). A good system captures the first. But every time you add a condition or tweak a value to improve past results, you risk fitting the second.
Think of a student who memorises every answer on last year's exam without understanding the method. Full marks on the old paper, failure the moment the questions change slightly. An overfitted system behaves the same way.
See the chart below.
Warning signs
- Many parameters. Dozens of settings: several indicator periods, time filters, day-of-week filters.
- Odd values. A 37-bar average, RSI 13, a level of 71.5, found by trying everything and keeping the best.
- An equity curve that is too smooth. Almost a straight line for years with unnaturally small drawdowns.
- Neighbouring values give very different results. RSI 14 is profitable but RSI 13 and 15 lose money. You found a spike of luck.
- Few trades relative to conditions. Ten rules, forty trades.
Suppose any idea with no real edge has a 5% chance of "looking good" in a test purely by luck. Try 20 ideas and the expected number of lucky passes = 20 × 0.05 = 1 idea. Try 200 ideas: 200 × 0.05 = 10 ideas. Now parameters: 5 parameters with 10 values each = 10 × 10 × 10 × 10 × 10 = 100,000 combinations. Picking the best of 100,000 almost guarantees you pick the one that was luckiest on that data, not the one that will be best in the future.
How to prevent and detect it
1. Split in-sample and out-of-sample
Split the data before you start. With 10 years of data, for example, build and tune on the first 7 (in-sample) and keep the last 3 (out-of-sample) for a single final test. If you look at the later period and go back to change the system, it is no longer out-of-sample. The MT5 Strategy Tester's Forward option does this split for you.
2. Walk-forward
Repeat the process: optimize on one window, test on the next unseen window, then slide forward. Chained together, the unseen-window results are much closer to what live trading would look like.
3. Look for plateaus, not spikes
When optimizing, look at how neighbouring values perform. A robust system gives similar results across a broad range of values (a plateau). Pick a value in the middle of the plateau, not the single peak surrounded by cliffs.
4. Test other markets and periods
If an idea has a sound reason behind it, it often still works reasonably on similar markets or nearby timeframes without re-tuning. If it only works on gold H1 for one particular year, be suspicious.
5. Use fewer conditions
A few rules you can explain beat twenty rules that make the curve pretty. Every added condition should answer "why should this work?", not just "because the backtest improved".
6. Expect degradation
Even without overfitting, live results are usually worse than the backtest because of costs and execution. Always set expectations below the test results and confirm with a forward test.
Weaknesses / common mistakes
- Thinking one out-of-sample pass makes it safe. Test many systems on the same holdout and keep the winner, and you have overfitted to the holdout.
- Re-optimizing after every loss. That is chasing noise in real time.
- Optimizing every parameter at once. It multiplies the chance of a lucky combination.
- Disliking simple systems. Simple looks boring but tends to be sturdier.
- Not counting attempts. Record how many ideas and parameter sets you tried, so you can judge the odds of a fake.
- Fixing overfitting with more overfitting. For example, adding "no trading on Wednesdays" because past Wednesdays lost money.
On a phone
You cannot seriously optimize a system on a phone. What you can do is keep logging live results and compare them with the backtest regularly. If live results stay far from the backtest, that may be a symptom of overfitting worth investigating on a computer.
Summary
- Overfitting means a system memorised past accidents instead of repeatable patterns.
- The more ideas or parameter sets you try, the more likely a good result is luck.
- Hold data back, use walk-forward, and choose values on a plateau.
- A few rules with a reason beat many rules that flatter the curve.
- Confirm every system on data it has never seen.